Product categories
|
Reporting periods
|
||
|---|---|---|---|
| Name | Pillar | Earliest data | Latest data |
| Industry-wide pension funds | Occupational (Pillar II) | 2000 | 2024 |
| Life Insurance funds | Voluntary (Pillar III) | 2000 | 2024 |
| Company pensions funds | Occupational (Pillar II) | 2016 | 2024 |
Resumé
Danmark har et stærkt og internationalt anerkendt pensionssystem, der skal sikre ældre en stabil levestandard. Systemet bygger på tre søjler: de offentlige pensioner (folkepension og ATP), arbejdsmarkedspensionerne og private pensionsordninger. Gennem de seneste årtier er de to sidstnævnte søjler blevet stadig vigtigere, og ni ud af ti danskere har i dag en arbejdsmarkedspension, og hovedparten af arbejdsgiverne har enten via overenskomster eller firmaaftaler forpligtet sig til at indbetale til medarbejdernes pensionsordninger. Systemet har medført, at kun få pensionister lever i økonomisk fattigdom, og dækningsgraderne er høje. Danmark står dermed relativt godt nu, hvor de rigtigt store årgange når pensionsalderen.
I 2024 blev der gennemført en væsentlig ændring i pensionssystemet, idet arbejdsindtægt ikke længere modregnes i folkepensionen. Pensionssatserne blev samtidig reguleret op med 3,3 %.
Den samlede pensionsformue udgør nu omkring 200 % af BNP, og pensionssektoren står for ca. 40 % af Danmarks udenlandske investeringer. Branchen bidrager dermed væsentligt til betalingsbalanceoverskuddet, der i 2024 svarede til 12 % af BNP.
Systemet står således solidt, men der er fortsat debat om, hvorvidt man skal bibeholde den gældende aftale om, at pensionsalderen stiger i takt med levetidsalderen. Det kan give problemer, hvis den debat resulterer i større afvigelser. Den stigende opsparing og robuste investeringsresultater viser dog, at det danske pensionssystem fortsat er både økonomisk og samfundsmæssigt bæredygtigt.
Summary Denmark has a strong and internationally recognised pension system designed to ensure a stable standard of living for older citizens. The system is built on three pillars: public pensions (Folkepension and ATP), occupational pensions, and private pension schemes. Over the past decades, the latter two pillars have become increasingly important, and today nine out of ten Danes have an occupational pension. Most employers are obliged, either through collective agreements or company arrangements, to contribute to their employees’ pension schemes. The system has resulted in only a small share of pensioners living in economic poverty, and replacement rates are high. Denmark is therefore in a favourable position as the large post-war generations reach retirement age.
In 2024, a significant reform was implemented as employment income is no longer set off against the state pension (Folkepension). At the same time, pension benefits were increased by 3.3%. Total Danish pension assets now amount to around 200% of GDP, and the pension sector accounts for about 40% of Denmark’s foreign investments. The sector thus contributes substantially to the current account surplus, which in 2024 equalled 12% of GDP.
The system therefore remains robust, although there still is an ongoing debate about whether to maintain the existing agreement linking the statutory retirement age to life expectancy. Significant deviations from this principle could pose challenges. Nevertheless, rising savings and solid investment results demonstrate that the Danish pension system remains both financially and socially sustainable.
6.1 Introduction: The Danish pension system
The Danish pension funds administer investments worth more than EUR 670 billion. The main aim of these investments is to give the pension savers the best possible rate of return. 2022 was challenging and the worst year since the 2008 financial crisis. The insurance and pension sector lost a total of 92-93 billion euro—primarily due to losses on bonds and interest rate derivatives from rising interest rates. In 2023 the trend reversed with large increases and is now back on track.
The average real net return of industry-wide pensions funds was 7.1% in 2024, -0.5% for company pension funds, and 16.5.0% for life insurance, compared to -31.1% in 2022 for pensions funds (industry- and company-wide) and -20.33% for life insurance (in 2022 the real return was weaker than the nominal return as inflation pushed the losses further into negative territory.
Despite the huge losses in 2022, the annual real net returns since 2017 until now have been 3.0% for industry-wide pension funds, 0.6% in company pension funds and -1.1% in life insurance funds.
The Danish ATP, in particular, suffered and experienced large investment losses in especially the first half of 2022. The real return of ATP, whose investment portfolio consisted mainly of long-term interest-bearing securities, was nearly -38% (EUR -8,6 billion). The crash of Arbejdsmarkedets Tillægspension (ATP) stands out and and generated significant debate, given that it is a mandatory pension saving scheme. Even though all of the country’s pension companies had to report significant losses on their investments in 2022 the situation in ATP was called catastrophic due to the fact that the loss in ATP’s case was several times larger than that of the others.
In 2023, many pension companies regained what they lost the previous year, but for ATP, with a loss of EUR 8.6 billion in 2022 and a result of EUR 0.76 billion, this was certainly not the case. Again i 2024 ATP pension fund reported a negative investment return (-0.6%) compared to +5.5 % (EUR 0.76 billion) in 2023. Due to the weak result, ATP’s investment strategy has been a recurring topic of public and expert debate. Some economists and commentators argue that ATP’s conservative portfolio structure — with a relatively low equity exposure — may have limited potential returns for members, particularly during periods of strong market growth. Critics suggest that the fund could deliver higher long-term returns if it accepted greater risk, while supporters emphasize the importance of security, predictability, and fairness in a mandatory national pension scheme.
Holding period
|
|||||||
|---|---|---|---|---|---|---|---|
| 1 year | 3 years | 5 years | 7 years | Whole reporting period | 10 years | to... | |
| Industry-wide pension funds | 7.1% | -0.8% | 2.1% | 3.0% | 2.7% | 3.3% | end 2024 |
| Life Insurance funds | 16.8% | -2.4% | -0.6% | 0.6% | 2.7% | 1.2% | end 2024 |
| Company pensions fundsa | -0.5% | -6.7% | -2.7% | -1.1% | 0.1% | NA | end 2024 |
| a Entry fees apply to this product category but data are unavailable; returns are calculated on the invested part of contributions only | |||||||
| Data: Danske Finanstilsynet, FaktaOmPension.dk, Danske Finanstilsynet, Eurostat; Calculations: BETTER FINANCE | |||||||
Historically, the returns have been high, on average close to a real return of 5% after tax over the past 10-15 years (if we disregard 2022). The pension sector has been able to weather major crises such as the financial crisis, the period with low interest rates and the corona crisis. Although we have periodically seen declines, for example in connection with the corona crisis, the political situation with the trade war between the USA and China, Brexit (and currently with the war in Ukraine, where we do not yet know the effects), even significant losses have proven to be more than compensated. The largest investment losses are typically observed within the market interest-based pension schemes, while the guaranteed pension schemes typically achieved a result of just below zero. This illustrates a more cautious investment policy for the guaranteed products.
Pension system in Denmark: An overview
The Danish pension system is a three-pillar system:
- The aim of the first pillar (Pillar I) is to prevent poverty in old age. Pillar I provides all Danish pensioners with a minimum pension throughout life, and the size of the pension depends on the individual pensioner’s income and assets. In addition to the national pension, pillar I consists of ATP (labour market supplementary pension). ATP is legally binding for all wage earners. The contribution is the same for everyone and therefore not dependent on salary but dependent on one’s working hours. The employer pays 2/3 and the employee 1/3. The pension benefit is a guaranteed annuity.
- The second pillar (Pillar II) is based on collective agreements in the labour market or employment contracts ensuring that the individual contributes to a defined contribution, funded pension scheme. Collective agreements determine the contribution rates, and the pension therefore depends on income earned throughout the working career. Pillar II aims to secure a standard of living reflecting the level of income before retirement.
- The third pillar (Pillar III) provides individuals with opportunities for supplementary saving based on their needs, both in explicit pension saving schemes with special tax treatment and in general voluntary savings.
Statutory ages in the pension system (for public pensions, for early retirement, and age limits for payment of funds from pension schemes) are established by law and thus regulated at the political level. The effective retirement age has been gradually increasing over the years, and it is currently set at 67 years old. A sequence of reforms has tightened the possibilities for early retirement and increased the statutory pension age (and early retirement age). The statutory pension age has increased in steps from 65 years old to reach 67 years old in 2022. Thereafter the statutory retirement age is indexed to the evolution of life expectancy. There is a “speed limit” stipulating that the statutory retirement age can be increased by more than one year every fifth year. In accordance with the indexation rules, parliament decided in 2015 to raise the statutory retirement to 68 years old in 2030, and in 2020 it was increased to 69 years old in 2035. In May 2025 the statutory retirement age was according to the evolution of life expectancy, increased to 70 years but the leading party in the government (the Social Democrates) announced that it was the last time they’ve voted for the automatic increase and that they would no longer follow the current agreement on retirement ages increasing alongside increased life expectancy. Politically, this has led to an intense debate which will continue up to the next parliamentary election, as the ongoing debate regarding work versus leisure requires attention.
The sustainability of the system depends critically on this development in retirement ages (increasing alongside increases in life expectancy). For the time being, the indexation scheme is being debated, and it is questioned whether it is too harsh, especially when implying a statutory pension age above 70 years. This can be a challenge, as many want to retire much earlier as they become wealthier due to the occupational pensions, and debates have arisen about more flexible exit routes from the labour market in order to encourage people to work longer.
The higher statutory pension age has also prompted a discussion of early exit options from the labour market for those who have reduced work capability, but not to the extent that they are eligible for a disability pension. In 2020, the so-called senior pension was introduced, giving the option to retire six years prior to reaching the statutory retirement age, provided work capability is reduced (unable to work at least 15 hours per week) and there is a sufficiently strong work record. A new scheme “early pension” (tidlig pension) was introduced in January 2022, available to individuals who, at the age of 61, have worked at least 42 years in the labour market.
For the moment it is unclear whether the government still wants to keep the senior and the early pension.
Finally, early retirement (efterløn) remains an option to retire within a window (reduced from five to three years after reforms) before reaching the statutory pension age for individuals who have contributed to the scheme for at least 30 years. The number of individuals eligible for early retirement is decreasing.
Pillar I
Pillar I essentially consists of two pension plans: the tax-financed public pension (Folkepension) and the ATP, a mandatory pension scheme that covers the majority of the population. Both schemes are regulated by law. The state pension (Folkepension) includes a basic amount (flat-rate pension) and means-tested supplements — I: supplementary pension (pensionstillægget) and II: supplementary pension benefit (ældrecheck). In addition, there are needs-based supplement, e.g., housing, medical expenses. The supplements are means-tested on a family basis.
Everyone is entitled to the public pension upon reaching the statutory retirement age, provided they meet the residence requirement and their earned income is below a certain threshold. Public pensions are indexed to wages. The state pension consists of a basic pension and a personal supplementary pension. For 2024 the base pension is DKK 83 136 per year (EUR 11 129), and the maximum supplement (for a single person) is DKK 96 192 per year (EUR 12 877). The means-testing is relatively complicated, depending on family circumstances and other sources of income.
ATP (The Labour Market Supplementary Pension Scheme)}
ATP (Arbejdsmarkedets Tillægspension) is Denmark’s largest pension fund and one of the largest pension funds in Europe. ATP manages assets of approximately EUR 147 billion, placing it among the top funds in Europe, alongside major players like ABP in the Netherlands and Alecta in Sweden. ATP is part of the Danish welfare system for old-age pensioners (introduced in 1964). By law, all wage earners and recipients of transfer income contribute to the supplementary labour market pension. It is a contribution-funded scheme to which everyone pays the same fixed amount, depending on working hours. In 2024, the annual contribution amounts to DKK 3564 (EUR 475), a rate that has remained unchanged in nominal terms since 2016. For employees, the contribution is shared between employer and employee, with employers paying two-thirds and employees one-third through their salary. Self-employed persons pay the full annual contribution of DKK 3,564 themselves. The pension benefit takes the form of a guaranteed life annuity, and for a person in full-time employment, the ATP pension corresponds to roughly one-third of the basic public pension.
As of 2020, a mandatory pension scheme has been introduced for recipients of public transfers. The contribution rate, paid by the state, starts at 0.3% and increases in steps to 3.3% in 2030. The contributions are part of the ATP-pension.
Pillar II
Occupational pensions are the result of collective bargaining. Before 1990, Pillar II schemes were almost exclusively for civil servants and white-collar workers in the private sector. A tripartite agreement between the government and the social partners in the late 1980s resulted in occupational pension schemes being available to the larger part of the labour market.
Pillar II Defined benefits (DB) schemes: Previously, it was common for civil servants in both the state and local governments to be entitled to a tax-financed DB pension (Tjenestemandspension). These schemes are being phased out.
Pillar III
In principle, Pillar III pension schemes provide the same opportunities for the individual citizen as occupational schemes. The products available and tax rules are approximately identical. Individual schemes are offered by banks, insurance companies, and most pension funds, but only if the saver is already enrolled through their job. The strong growth of Pillar II schemes has, to some extent, diminished interest in individual savings in explicit pension schemes. Also, changes in tax regulation have negatively affected the demand for Pillar III schemes. Moreover, many households hold assets outside the pension scheme, primarily in the form of real estate and shares.
Transition from Pillar I to Pillars II and III
The Danish pension system is transitioning from being largely based on defined-benefit, tax-financed pensions to a greater role for defined-contribution, funded occupational pensions. The latter were expanded to most of the labour market in the 1990s and will mature over the two decades. It is expected that by 2040, pension payments will correspond to contributions and we will see the first large cohorts of pensioners who have saved for their pension throughout their working lives. However, payments from the labour market pension are expected to overtake the national pension as early as 2030.
The arrangement serves both to ensure decent pensions for all pensioners, and to maintain pension adequacy in terms of high replacement rates. It is essential to have a robust pension system to ensure the confidence of the financial markets in the long-term sustainability of the economy.
The system is financially robust and prepared for an ageing population, which is absolutely essential to maintain confidence of financial markets in the long-term sustainability of the economy. In international comparisons, the Danish pension system stands out for its low poverty rates among the elderly and high replacement rates. Financial viability, against the backdrop of large demographic shifts, is ensured. This position is reflected by its consistent ranking in the top A-tier, after the Netherlands and Iceland, in the Melbourne Mercer Global Pension Index 2024 (Mercer, CFA Institute, and Monash Business School 2024).
The challenges for the system include how to ensure an incentive structure that supports saving and later retirement. The sustainability of the system depends critically on retirement ages increasing in line with rising life expectancy, as mentioned earlier. The heterogeneity in work careers and health has prompted debates on introducing more flexible exit routes from the labour market to encourage people to work for longer.
In 2024, a significant step was taken in this direction, as working pensioners no longer experience income deductions in their basic state pension (Folkepension). This reform strengthens the incentive for older individuals to remain in the labour market while receiving their pension. At the same time, state pension benefits were increased by 3.3%.
In addition, Denmark has since 2019 offers a tax-free senior premium (seniorpræmie) for individuals born in 1954 or later who continue working after reaching the statutory retirement age. Eligible persons who remain in employment for at least 1560 hours within the first year after reaching the pension age receive a tax-free lump sum of DKK 48 555 (2025), and those who continue for a second year receive DKK 28 902 (2025). The premium is adjusted annually and can be earned independently for each year of work after pension age. Together with the removal of the pension offset for employment income, this measure has further strengthened incentives for older workers to remain in the labour market.
Politically, the debate over the Danish pension system is expected to intensify in the run-up to the next parliamentary election, which is less than a year away. Discussions are likely to focus on how to adjust and secure the long-term sustainability of the pension system, while maintaining a fair balance between work and leisure. Moreover, it remains a challenge that not all groups are yet covered by occupational pension arrangements.
6.2 Long-term and pension savings vehicles in Denmark
Private pension schemes are administered by pension funds, insurance companies, or banks. This applies to both Pillar II and Pillar III.
A Danish industry-wide pension fund (pensionskasse) is a legal entity owned and governed by its members. A pensionskasse can offer the same kind of products as a life insurance company and is subject to the same regulations as a life insurance company - specifically, the Solvency II Directive.
The first occupational schemes for civil servants were established in pensionskasser, which provided pension schemes for specific professions, e.g. nurses, whereas occupational pension schemes in the private sector originally covered employees with different professional backgrounds working within the same company. Such schemes used a life insurance company as a vehicle.
Today, the differences between the legal forms have lost importance. Many occupational pension schemes in the private sector are now industry-wide and administered by life insurance companies. But still, a distinction is often made between industry-wide schemes and company schemes.
Industry-wide schemes are typically more standardised, offering limited freedom of choice to individual members, as all decisions are made collectively. The pension provider is only indirectly exposed to competition since customer mobility is low. These characteristics generally make these schemes relatively affordable.
Insurance companies administering company schemes are more exposed to competition, as company schemes more frequently switch pension providers. In general, company schemes offer more individual options, e.g., regarding insurance coverage and the choice between a guaranteed or non-guaranteed scheme. Therefore — overall — the insurance companies have higher costs, particularly related to acquisition and individual counselling.
An occupational pension scheme typically provides coverage for old age, disability, and early death. Coverage for critical illness and even healthcare are other insurance benefits that have become common. Typically, 15%–25% of contributions are allocated to cover social risks other than old age, a trend that appears to be increasing.
The supply of pension products is regulated partly by tax law and partly by general regulations for insurance and banking. The regulation is the same for both Pillar II and Pillar III. This means that insurance companies and pension funds, on the one hand, and banks, on the other, provide competing products to the market. Products offered by life insurance companies and pension funds may accumulate savings but must also cover some kind of insurance risk — such as longevity, death, or disability — whereas banks can only act as intermediaries of insurance coverage supplementary to a saving product.
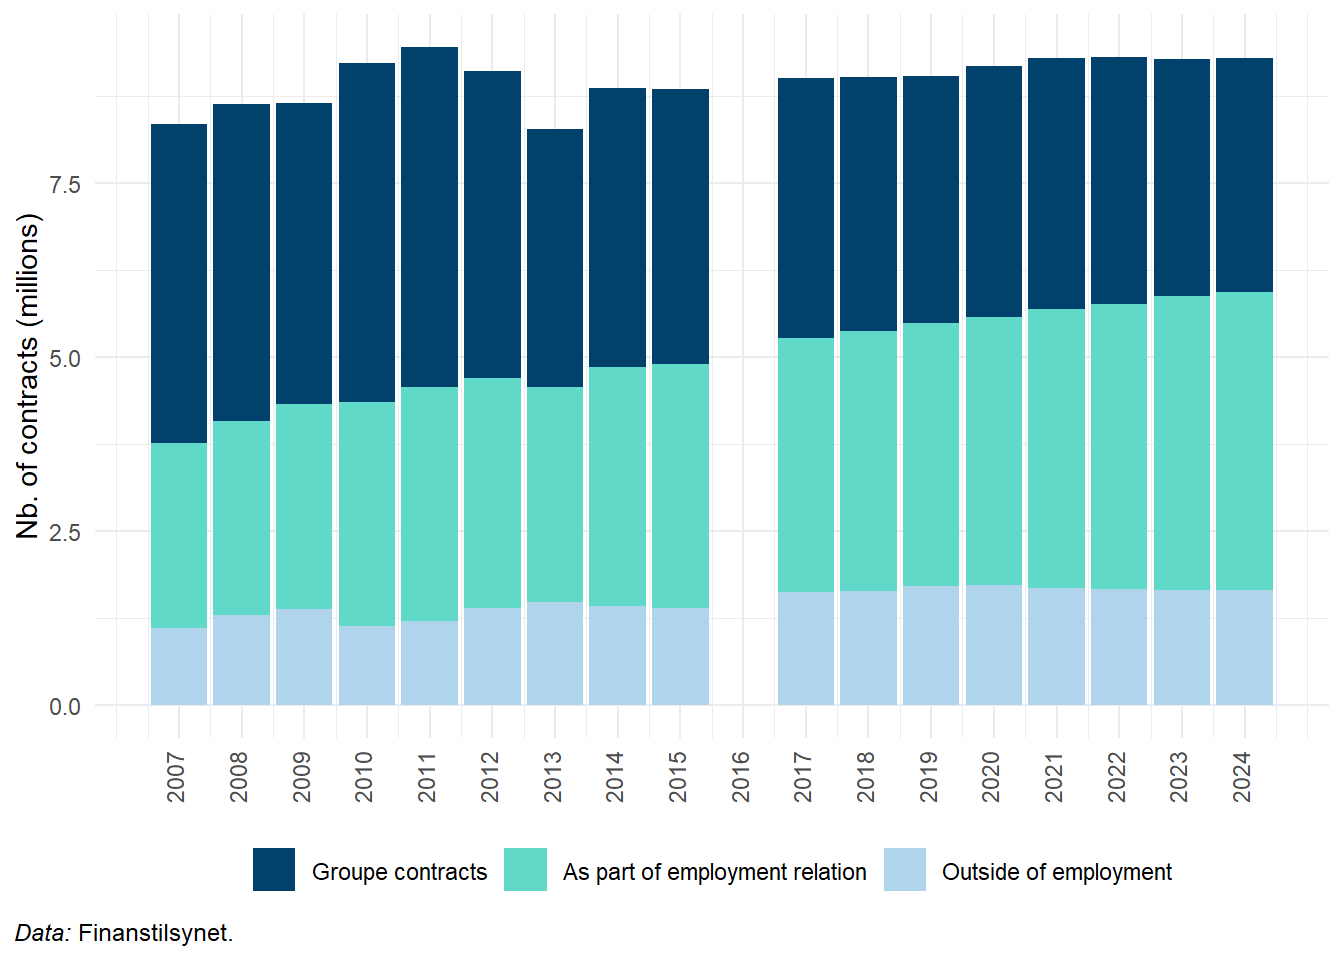
The number of contracts outside employment relationships has risen from around 15% to 22% of all contracts from 2007 to the present. Meanwhile, employment-based contracts have gained ground, increasing from about one-third of total contracts 15 years ago to nearly half today. Group contracts, however, have moved in the opposite direction: once comprising 50-60% of all contracts, they have now dropped to less than 40%.
As shown in Figure 6.2, life insurance has grown quite significantly over the past 20 years and today holds by far the largest assets under management, largely because many occupational pension schemes are administered by life insurance companies. Banks are managing a progressively smaller share, though they have maintained their position in the past two years, with only a marginal decrease of 0.1% from 2021 to 2022, followed by a slight increase to 8.1% in 2023. Industry-wide pensions remain more or less stable. Pension companies have consistently held the smallest share, and today only manage around 1%.
ATP is not included in the figure due to its special role, as it was established by law with statutory pensions and is considered a Pillar I pension. Until recently, ATP was the largest pension and administration company in Denmark, but according to Børsen (October 2025), PFA Pension has now overtaken ATP, with total assets under management rising to DKK 732 billion, compared to ATP’s DKK 701 billion reported in its 2024 financial statement. The difference, however, is largely due to ATP’s sensitivity to interest-rate developments: as interest rates fall, ATP’s bond portfolio typically gains in value, which would increase its total assets again.
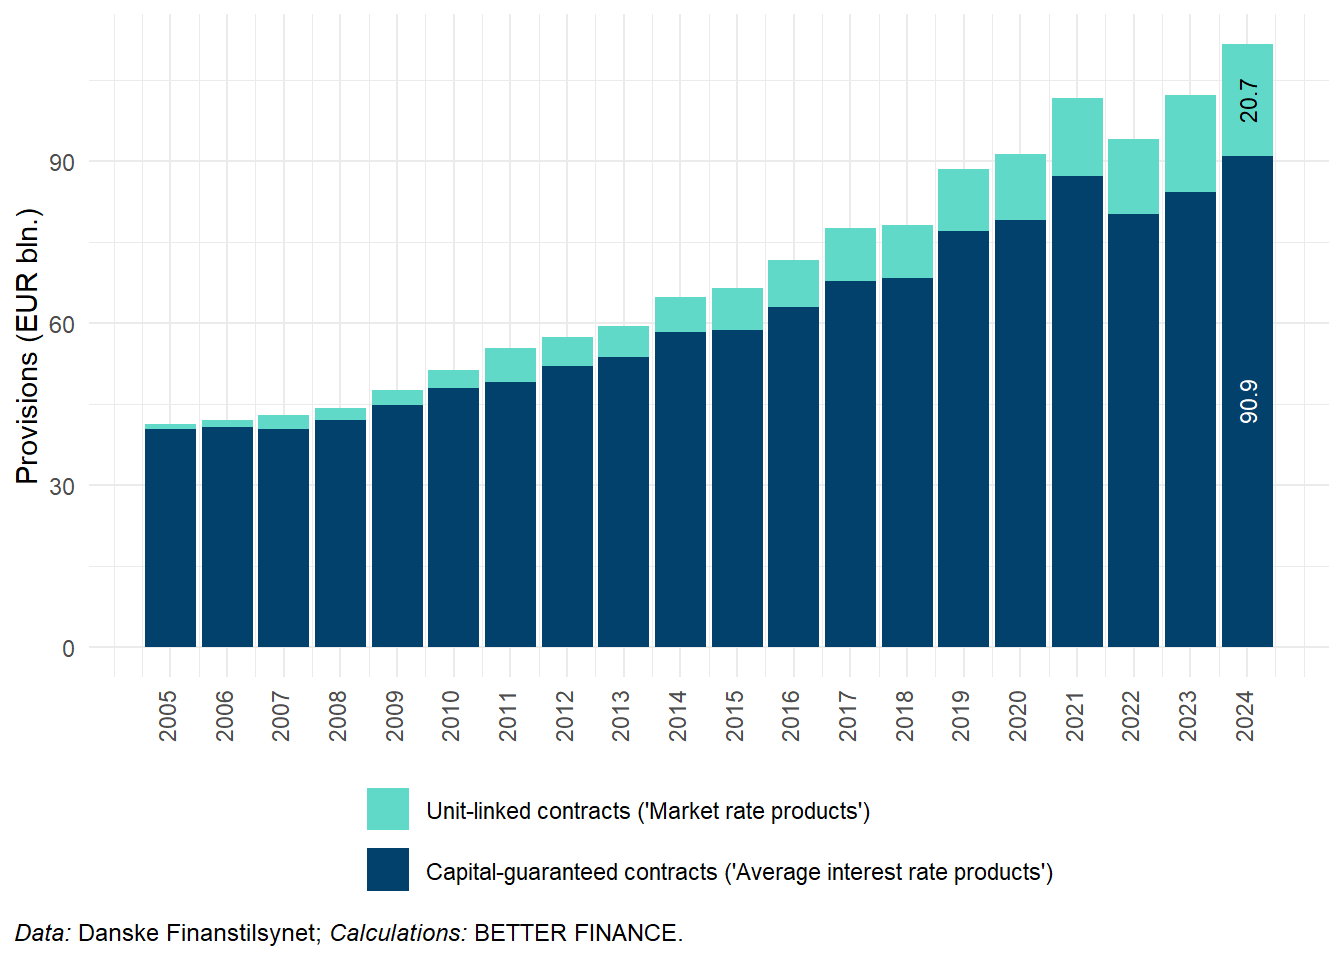
Figure 6.3 and Figure 6.4 display the breakdown of assets under management (AuM) by type of products in life insurance and industry-wide pension funds. As we can see, unit-linked contracts (“market rate products”), which were non-existent until 2001, now represent two thirds of all AuM in life insurance (EUR 230.3 billion). By contrast, capital-guaranteed life insurance (“average interest rate products”) seems to have reached a ceiling slightly above EUR 100 billion since 2006-2007 (EUR 106.5 billion in 2023). Conversely, in industry-wide pension funds, capital-guaranteed products still by far constitute the largest share of AuM, with a much more limited growth of unit-linked products.

Pillar II: Occupational pension funds
Occupational pensions are an outcome of collective bargaining.1 Before 1990, Pillar II schemes were almost exclusively for civil servants and white-collar workers in the private sector. A tripartite agreement between the government and social partners in the late 1980s resulted in occupational pension schemes for the larger part of the labour market.
Contribution rates were gradually increased during the 1990s and 2000s and have for most sectors remained broadly stable since around 2010. However, rates vary across occupational groups and collective agreements. The typical contribution for private-sector workers is still around 12% of earnings (with the employer paying two-thirds and the employee one-third), although some agreements — for example in retail and administrative sectors — have increased to 13% as of 2025. In the public sector, contribution rates are generally higher, often between 15% and 18%. As the occupational pension schemes were only fully phased in from the 1990s onward, most pension funds are still in a net accumulation phase, with contributions exceeding pay-outs. Contribution structures continue to evolve through collective bargaining and, occasionally, tripartite agreements — such as the 2023 accord granting extraordinary wage increases for nurses — reflecting the adaptability of the Danish labour market model.
Total contributions to occupational pension schemes amounted to DKK 141 billion (EUR 18.8 billion) in 2024, setting another new record. We also saw a record in 2023 that more than doubling the amount contributed 20 years ago (Forsikrig & Pension 2024). The increase in 2024 is linked to continuously rising employment and rising wages, which has driven up occupational pension contributions. Payments to privately subscribed pension schemes have also grown after almost stagnation in 2023, rising from DKK 17.1 billion in 2022 to 17.2 billion in 2023 and further to DKK 18.3 billion (EUR 2.4) in 2024.
In 2024, Danes contributed DKK 159 billion (EUR 21.2 billion) to pension savings, marking an increase of 4.7% compared to 3.3% in 2023, which was already the highest recorded amount since these statistics began in 2002. At the same time, the insurance and pension sector generated a return of EUR 46 billion.
All private pension schemes are fully funded, with the vast majority being Defined contributions (DC) schemes. Even in the very few DB schemes, where the employer guarantees a pension proportional to the salary, the guarantee must be funded in a pension fund or a life insurance company.
Between 80% and 90% of all working people contribute to a Pillar II scheme within a year. However, there is a so-called residual group comprising (i) persons not covered by an occupational pension, (ii) persons with interrupted working careers (e.g., due to unemployment, sickness, or parental leave), who may not contribute consistently throughout their working years, and iii) self-employed individuals. Ongoing discussions aim to address this issue, with the recently introduced mandatory pension (see above) representing a partial solution. Pillar II schemes are typically established in life insurance companies, pension funds (pensionskasser) or—less commonly—in banks (around 3.5-4%).
Pillar DC: Today, only about 30 000 civil servants in the state are still entitled to this type of pension upon retirement and is continously falling. Civil servants in local governments now enrol in DC schemes, and the very few remaining DB schemes are typically funded through insurance companies. A small number of private companies still offer DB schemes for some of their employees. These schemes are funded in dedicated pension funds—Pensions company funds firmapensionskasser. Their importance has been decreasing for many years, along with their total assets and the number of people insured. Today, only four firmapensionskasser hold assets exceeding DKK 1000 million (EUR 134 million), constituting around 1% of the total market, and most of these funds no longer enrol new members.
Pillar III
In principle, Pillar III pension schemes offer the same opportunities for individual citizen as occupational schemes. The products available and tax rules are approximately identical. Individual schemes are provided by banks, insurance companies and most pension funds.
As mentioned earlier, the strong growth of Pillar II schemes has reduced the interest in individual savings in specific pension schemes. While the number of occupational schemes increased by 34% from 2000 till 2022 individual schemes fell by 36%.
In 2000, around 1064 thousand people contributed to one or more individually subscribed pension schemes. The number declined steadily until 2013 (to about 571 thousand), before increasing again to around 676 thousand in 2021. The sharp fall in 2013 mainly reflects the transition from kapitalpension to alderopsparing. It likely took time for savers to familiarise themselves with the new scheme, and the introduction of a contribution cap on ratepension in 2012 also contributed to the decline. Since then, participation has fluctuated somewhat. A notable drop between 2018 and 2019 appears mainly linked to tax-related changes, including the introduction of a contribution ceiling for ratepension and the conversion of some contracts into alderopsparing, rather than a real decline in interest in individual saving. By 2024, the number of contributors had returned to roughly the same level as in 2018.
In 2024, contributions to individual schemes were nominally DKK 18 301 million. (EUR 2446 million). As already mentioned, tax rules have changed, especially for periodic instalments and lump sum pensions , which may have had an impact on the demand for Pillar III schemes. In Pillar II schemes, regulatory changes have led to growing contributions to lifelong annuities, but the same substitution has not been observed in Pillar III. Savings in banks used to play a more important role for individual schemes than for occupational schemes. Until 2013, when the tax regulation for lump sum pensions was changed, individual pension saving schemes were predominantly held in banks rather than in insurance companies or pension funds. Today (in 2024), about 45% of contributions were held in insurance companies or pension funds, just under 30% in banks, and the remaining 25% were uncategorised in the available statistics.
6.3 Charges
The level of costs has received increasing attention in recent years, partly due to the low rate of interest in the market until mid-2022.
Analysis from The Money and Pension Panel—an ad hoc council under the Ministry of Industry, Business and Financial Affairs— indicate that even minor increases in Annual Percentage Rate (APR) can significantly impact pension savings. The panel calculated that a 0.5 percentage point rise in APR could necessitate delaying retirement by approximately two years to maintain expected living standards in old age, according to a 2018 report.
The Danish FSA has analysed the development of administration costs, including costs related to acquisitions and sales, but excluding investment costs. Administration costs have declined over the last 10 years to 0.19% of total provisions in 2017, before rising slightly again. The FSA distinguishes between market-oriented insurance companies (mainly running company pension schemes) and non-market-oriented insurance companies/pension funds (mainly running industry-wide pension schemes). Since industry-wide pension schemes are typically governed by customer representatives, and since their schemes are often very standardised, they are generally cheaper to administer than company schemes.
Transparency of costs has increased. Since 2011, life insurance companies and pension funds have agreed to inform all their customers of their total charges in DKK (ÅOK) and their total charges as a percentage of the value of their pension savings (ÅOP) calculated on the basis of the total value of their savings at year-end.
These key figures include direct and indirect administration costs, direct and indirect investment costs, charges to the company for any guarantees and other kinds of risks, as well as any charges paid by the life insurance company to intermediaries. How total costs are allocated to individual customers is decided by each insurance company or pension fund, but the key for distribution is controlled by the external auditor to ensure consistency between the figures in the annual report and total distributed charges (ÅOK/ÅOP).
For market comparisons between life-insurance companies and pension funds, key figures for several standardised examples are published on the website faktaompension.dk. While higher administration costs always lead to lower pension benefits, it is difficult to evaluate investment costs. Investing in government bonds is very cheap, but it may not be the most profitable investment. On the other hand, investing in foreign equities is more expensive, but may offer a higher expected return. Therefore, the relationship between investment costs, investment risks, and expected investment return is not straightforward. Furthermore, pension companies’ investment management must take their liabilities into consideration. Some investments are made to hedge risks against, for example, changes in interest rates. When comparing investment costs, one must also consider the existence of guarantees.
The website faktaompension.dk offers the possibility to compare total charges of various pension companies for various types of customers. All figures are calculated and reported by the pension companies, and the website is run by the Danish Insurance Association. Additionally, the website pensionsinfo.dk provides individuals with access to information on all pension entitlements—public and private—and thus essential information to assess the adequacy of pension savings. The website also includes tools to assess the impact of retirement age on pension benefits. To increase transparency and facilitate comparisons, projections of future pension levels are also presented using common return expectations determined by the Council for Return Expectations.2
Pension Danmark
|
Danica Pension
|
PFA
|
|||||||
|---|---|---|---|---|---|---|---|---|---|
| I | II | III | I | II | III | I | II | III | |
| Total costs % | 1.7 | 0.6 | 0.6 | 4.7 | 1.2 | 1 | 2.3 | 0.9 | 0.7 |
| Total costs EUR | 66 | 492 | 1 623 | 177 | 933 | 2 793 | 77 | 682 | 2 096 |
| Total costs DKK | 489 | 3 668 | 12 104 | 1 317 | 6 957 | 20 831 | 571 | 5 088 | 15 632 |
| Of which Administration | 320 | 320 | 320 | 984 | 984 | 1 098 | 414 | 690 | 1 104 |
| Of which Investment | 169 | 3 348 | 11 784 | 333 | 5 973 | 19 733 | 225 | 4 512 | 14 914 |
| Data: faktaompension.dk, 2025. | |||||||||
Table 6.3 illustrates cost levels and costs structures for three typical different persons at different positions in the life-cycle (average for the 5 biggest companies).3 Costs in percent (ÅOP) are relative higher for young than older contributors, reflecting their lower level of accumulated assets. Administrative costs are relatively constant across types and hence matter relatively less - although purely occupational pension providers, such as PensionDanmark (which has included coverage for loss of earning capacity and critical illness in some of its plans) have lower administration costs than others. Investment costs, on the other hand, are higher for older contributors with larger accumulated assets. In general, charges are lower in the industry-wide schemes (Pillar II companies) which have the highest degree of standardisation and no acquisition costs. Charges in Life-Insurance (Pillar III) are about double those in Pension companies; see Table 6.4 and Table 6.5}.
| Year | Admin. and mgt. fees | Contract mgt. fees | Total Expense Ratio |
|---|---|---|---|
| 2000 | NA | NA | 0.40% |
| 2001 | NA | NA | 0.35% |
| 2002 | NA | NA | 0.34% |
| 2003 | NA | NA | 0.33% |
| 2004 | NA | NA | 0.35% |
| 2005 | NA | NA | 0.17% |
| 2006 | NA | NA | 0.16% |
| 2007 | 0.06% | EUR 49.92 | 0.14% |
| 2008 | 0.07% | EUR 51.96 | 0.13% |
| 2009 | 0.06% | EUR 53.82 | 0.13% |
| 2010 | 0.05% | EUR 46.89 | 0.13% |
| 2011 | 0.05% | EUR 51.96 | 0.14% |
| 2012 | 0.05% | EUR 53.71 | 0.12% |
| 2013 | 0.04% | EUR 56.37 | 0.11% |
| 2014 | 0.04% | EUR 54.16 | 0.10% |
| 2015 | 0.05% | EUR 48.04 | 0.10% |
| 2016 | NA | NA | 0.10% |
| 2017 | 0.03% | EUR 53.67 | 0.10% |
| 2018 | 0.04% | EUR 54.17 | 0.11% |
| 2019 | 0.04% | EUR 61.31 | 0.10% |
| 2020 | 0.04% | EUR 61.92 | 0.11% |
| 2021 | 0.04% | EUR 61.18 | 0.12% |
| 2022 | 0.05% | EUR 57.66 | 0.22% |
| 2023 | 0.06% | EUR 64.13 | 0.16% |
| 2024 | 0.06% | EUR 67.28 | 0.24% |
| Data: FaktaOmPension.dk, Danske Finanstilsynet Calculations: BETTER FINANCE. | |||
| Year | Acquisition fees1 | Admin. and mgt. fees | Contract mgt. fees | Total Expense Ratio |
|---|---|---|---|---|
| 2000 | NA | NA | NA | 0.68% |
| 2001 | NA | NA | NA | 0.65% |
| 2002 | NA | NA | NA | 10.86% |
| 2003 | NA | NA | NA | 0.77% |
| 2004 | NA | NA | NA | 0.64% |
| 2005 | NA | NA | NA | 0.60% |
| 2006 | NA | NA | NA | 0.56% |
| 2007 | 1.88% | 0.17% | EUR 49.92 | 0.55% |
| 2008 | 1.73% | 0.18% | EUR 51.96 | 0.55% |
| 2009 | 1.87% | 0.17% | EUR 53.82 | 0.54% |
| 2010 | 1.34% | 0.17% | EUR 46.89 | 0.41% |
| 2011 | 1.24% | 0.16% | EUR 51.96 | 0.43% |
| 2012 | 1.15% | 0.15% | EUR 53.71 | 0.40% |
| 2013 | 1.08% | 0.16% | EUR 56.37 | 0.35% |
| 2014 | 0.99% | 0.16% | EUR 54.16 | 0.34% |
| 2015 | 0.95% | 0.20% | EUR 48.04 | 0.31% |
| 2016 | NA | NA | NA | 0.25% |
| 2017 | 0.80% | 0.20% | EUR 53.67 | 0.27% |
| 2018 | 0.84% | 0.21% | EUR 54.17 | 0.27% |
| 2019 | 0.74% | 0.21% | EUR 61.31 | 0.26% |
| 2020 | 0.61% | 0.20% | EUR 61.92 | 0.23% |
| 2021 | 0.71% | 0.21% | EUR 61.18 | 0.22% |
| 2022 | 0.91% | 0.24% | EUR 57.66 | 0.23% |
| 2023 | 0.86% | 0.23% | EUR 64.13 | 0.25% |
| 2024 | 0.76% | 0.24% | EUR 67.28 | 0.46% |
| 1 % of premiums | ||||
| Data: FaktaOmPension.dk, Danske Finanstilsynet Calculations: BETTER FINANCE. | ||||
As seen in Table 6.4 and Table 6.5 charges in life insurance (Pillar III) are about double those in pension companies. There are several reasons for this. Generally, costs in life insurance companies and pension funds differ in terms of investment and administration expenses, influenced by factors such as the size of the institution, regulatory requirements, and the types of investment products offered. Life insurance companies often use complex financial products to support their guaranteed benefits, which typically require conservative investments and can be costly to administer. In contrast, pension funds without guaranteed returns may use lower-cost structures with higher exposure to equities and other more volatile assets, which can reduce expenses. Also, larger pension funds, such as PensionDanmark, may benefit from economies of scale, allowing them to maintain lower costs per member compared to smaller life insurance companies. For example, PensionDanmark has relatively low costs per member due to their substantial capital base, which enables them to negotiate better terms on investment products. It is worth mentioning, however, that these differences have been significantly reduced, likely due to increased focus on charges.
6.4 Taxation
Numerous changes in taxation have affected pension savings. The general trend has been to decrease marginal income taxes and broaden tax bases. Under the Exempt Taxed Taxed (ETT) scheme, the tax value of the deduction for a marginal increase in contributions depends on the marginal tax rate when contributions are made, while the taxation of the resulting pension depends on the marginal tax rate in retirement. In a progressive tax system, this marginal tax rate in retirement tends to be lower than during the contribution period (especially for middle-income groups), effectively creating an implicit tax subsidy for pension savings. Tax reforms that have reduced the progressivity of the tax system have therefore reduced this subsidy.
Taxation of returns was introduced as early as 1984. From that year, all interest earnings in pension schemes were taxed at a variable tax rate aimed at taxing all real interest above 3.5%. In 1998, this real interest rate tax was replaced by a proportional tax rate on all yields from pension assets. The tax rate is currently 15.3%, which is lower than the general taxation of capital income. For example, personal income tax rates on dividends and capital gains are 42% for income above EUR 8166 (2024) and 27% for income up to EUR 8166. The Danish Parliament had originally announced a significant increase in the upper threshold for the lower capital gains tax to the limit EUR 10 704 from 2025. However, it has been postponed to 2026 (as part of the financing of the Entrepreneurship Package (Iværksætterpakken), which includes the abolition of the so-called “tax from hell” (lagerbeskatningen) on unlisted shares. The delay means that the threshold for the 27% tax rate on capital income will be DKK 61 000 (EUR 8,166) in 2024 and DKK 67 500 in 2025, before increasing to the planned higher level in 2026. This change affects the timing of tax relief for investors and slightly prolongs the period during which capital income, including some pension-related investments held outside tax-advantaged schemes, will be taxed at the higher marginal rate.
Looking at the top rate of 42%, Denmark has the third-highest rate among Organisation for Economic Co-operation and Development (OECD) countries for dividend taxation, significantly higher than, for example, Norway (37.8%), Sweden (30%), and Germany (26.4%).
Even the 27% rate is well above the OECD average of around 24%, although there are substantial differences between member countries.
A challenging design issue is how to align public and private pensions. The former are means-tested to target the least well-off pensioners. This distributional approach creates a disincentive for individuals affected by means-testing, as increasing private pension savings may reduce public pensions through means-testing. This acts as an implicit tax, which increases the effective tax beyond those applying under the ETT scheme, especially for contributions made close to retirement. Hence, higher savings or later retirement (resulting in larger contributions via occupational schemes) can lead to high effective tax rates—in some cases even exceeding 100%. This is counter-productive to the objectives of strengthening savings incentives and encouraging later retirement, a dilemma that has prompted several reforms.
There have been numerous changes to the tax rules for contributions to lump-sum and periodic instalment schemes, especially in terms of caps on contributions. For individuals—such as the self-employed—with variable incomes and the capacity to make pension contributions, there is a case for allowing large contributions in a single year. However, this can also enable high-income groups to lower effective taxation. These two concerns have influenced policies in this area.
As discussed above, the lump-sum pension scheme was closed to new contributions in 2013 and was replaced by the aldersopsparing. This scheme follows a Taxed Taxed Exempt (TTE) principle, and pension payments are excluded from means-testing of public pension. This scheme was introduced primarily to reduce high effective tax rates on pension savings made close to retirement. Contribution caps depend on an individual’s age in relation to the statutory retirement age (see above), with a low cap for contributions made between 15 and 10 years prior to reaching the statutory retirement age, and a higher cap for contribution made 5 years or less prior to reaching the statutory retirement age. In addition, age-based tax reliefs for pension contributions have been introduced to reduce the effective taxation of pension savings. These reliefs involve a two-step, age-dependent tax rebate for pension contributions : 12% for contributions made between 15 and 5 years before reaching the statutory retirement age, and 32% for contributions made within 5 years of the statutory retirement age.
All these changes have added extra layers of complexity to an already complex system, meaning that taxation principles now involve a hybrid approach that combines both ETT and TTE schemes. Table 6.6 summarises this information.
| Product categories |
Phase
|
Fiscal Regime | ||
|---|---|---|---|---|
| Contributions | Investment returns | Payouts | ||
| Industry-wide pension funds | Exempted | Taxed | Taxed | ETT |
| Company pensions funds | Exempted | Taxed | Taxed | ETT |
| Life Insurance funds | Exempted | Taxed | Taxed | ETT |
| Source: BETTER FINANCE own elaboration, based on Danish Tax Authority. | ||||
6.5 Performance of Danish long-term and pension savings
Real net returns of Danish long-term and pension savings
In this section, we analyse the returns obtained by the members and policyholders of Danish industry-wide pension funds (since 2005) and life insurance (since 2003). Using firm-level nominal gross return data and costs from the Danish FSA, we first calculate nominal net returns, that is, annual returns after deducting the average annual costs and charges. Returns are aggregated for each year at the level of the product category by computing the simple average of returns reported by individual firms for the year. While an asset-weighted average would, of course, better reflect the aggregate performance, firm-level data on AuM is unfortunately not available. For industry-wide pension funds, we deduct the average value of costs as a percentage of AuM reported by individual pension funds for each year . For life insurance companies, extreme outliers make the average an unreliable measure, so we instead use the median value of costs reported by life insurance companies.
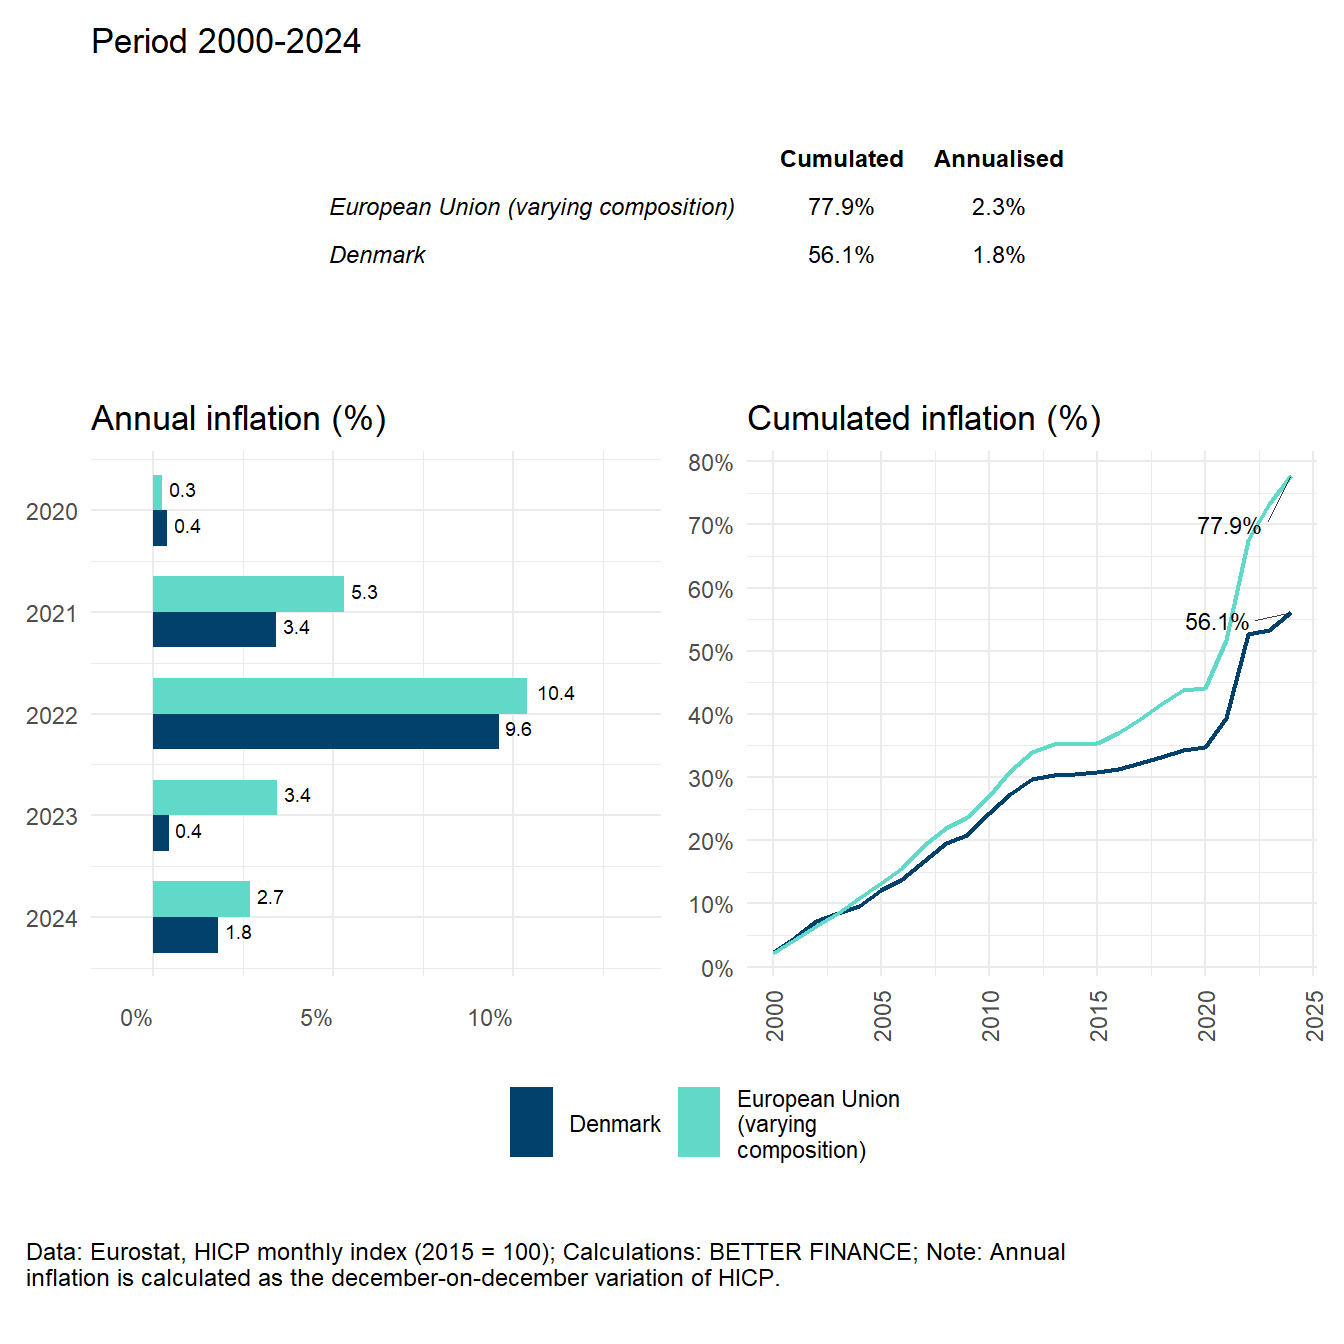
Second, we adjust these nominal net returns for inflation, thereby obtaining real net returns. The inflation rates we use for this are based on Eurostat’s harmonised index of consumer prices (HICP) index for Denmark, as per the methodology explained in the introductory chapter. As can be observed in Figure 6.5, Denmark ranks below the European Union (EU) average in terms of inflation, with an annualised inflation rate of 1.8% over the period 2000-2023, which amounts to a cumulative inflation of 53.34% over the same period, compared to 73.23% for the EU.
Figure 6.6 displays the returns of industry-wide pension funds over the period 2000–2024. As we can see, despite the market downturn in 2022, which resulted in losses in nominal terms (-7.6%), the recovery in 2023 (+10.3%) and the strong results of the previous years mean that for a holding period as short as 3 years, nominal annualised results are positive (+3.9%). The generally low fees levied by pension funds translate into nominal net returns that are very close to the nominal gross returns: As we can see, fees only reduce the annualised performance over 24 years by 0.2 percentage points (p.p.s), and the cumulated performance over the same period by only 11.8 p.p.s.
Inflation is the factor that most affect pension funds’ performance, as we can see in the annualised returns over all holding periods as well as in the cumulated returns in the lower pane of Figure 6.6. Inflation alone reduces the cumulated 24-year returns by 97.7 p.p., more than half of the cumulated nominal net returns.
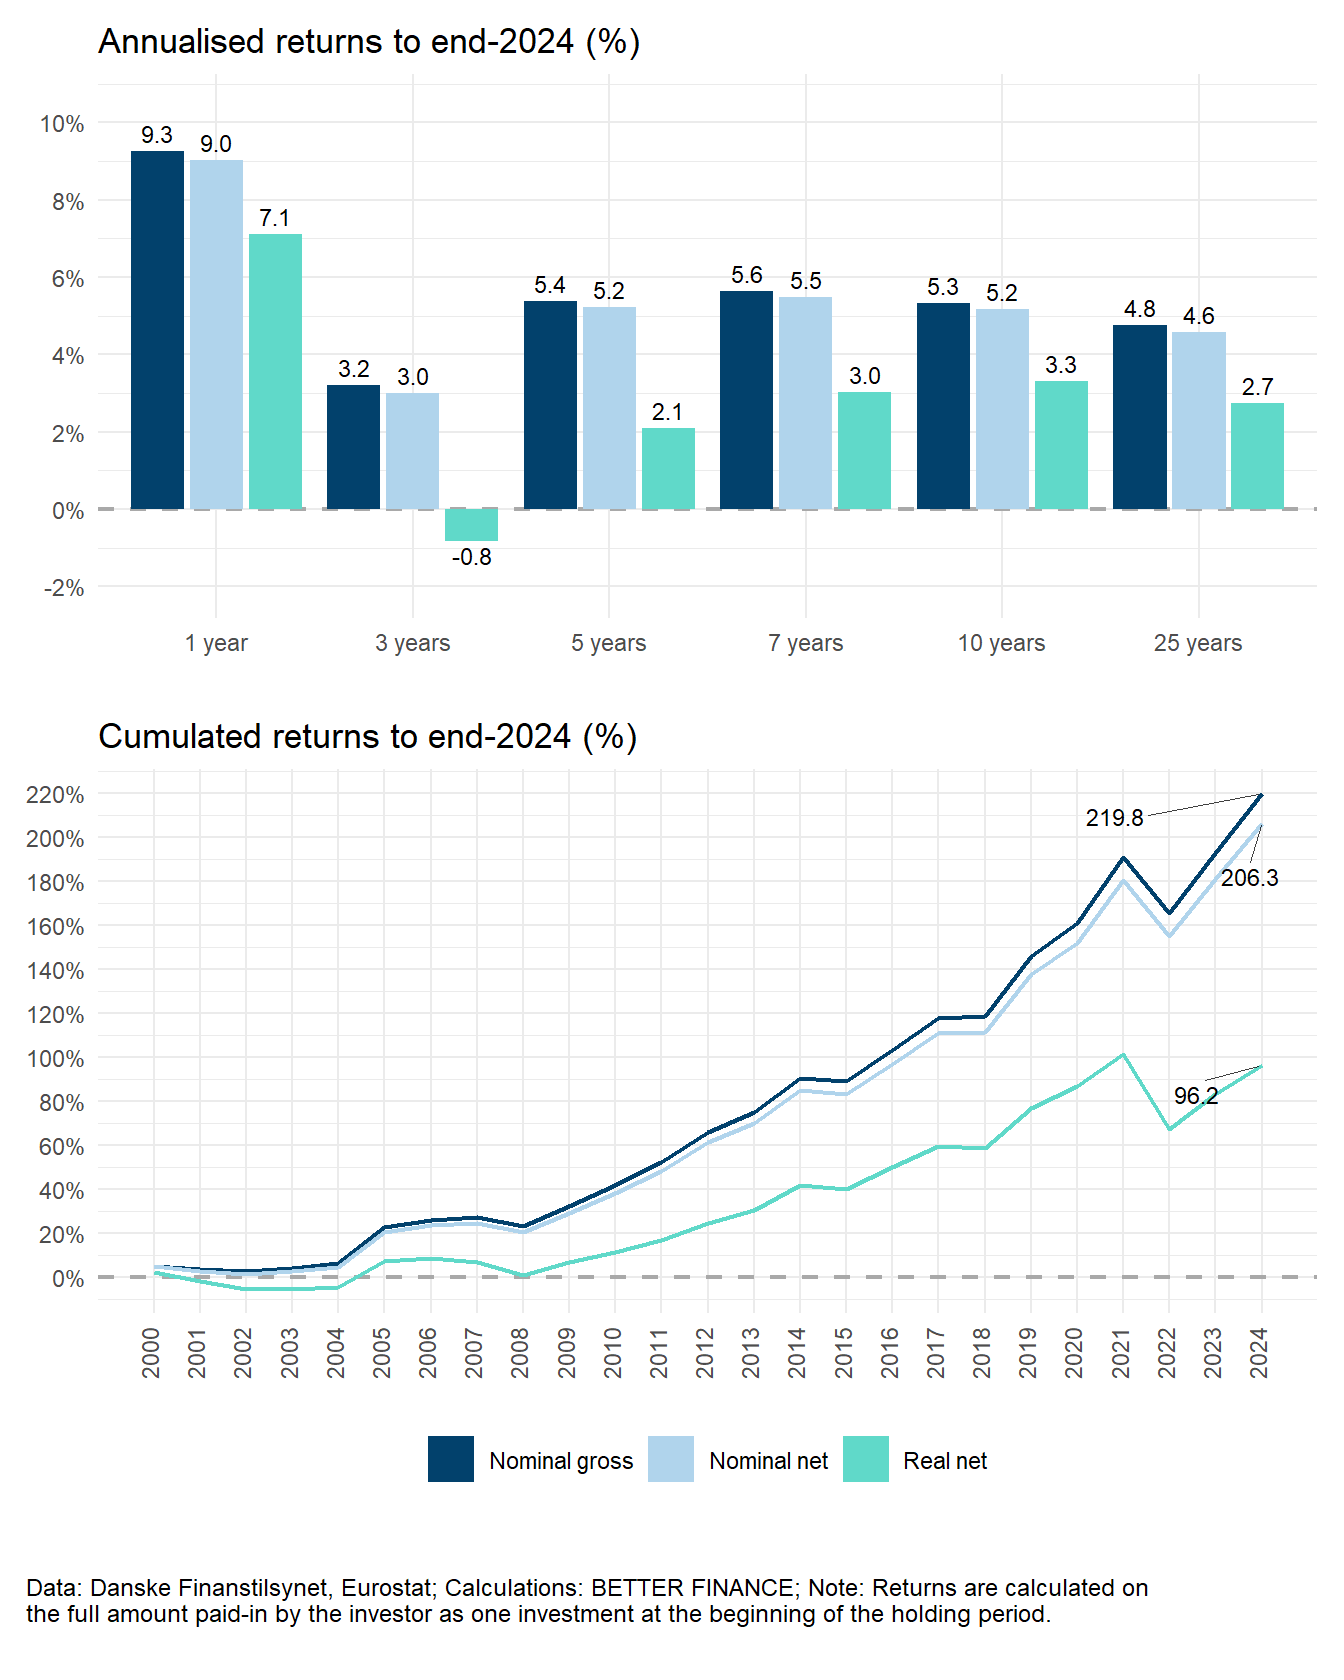
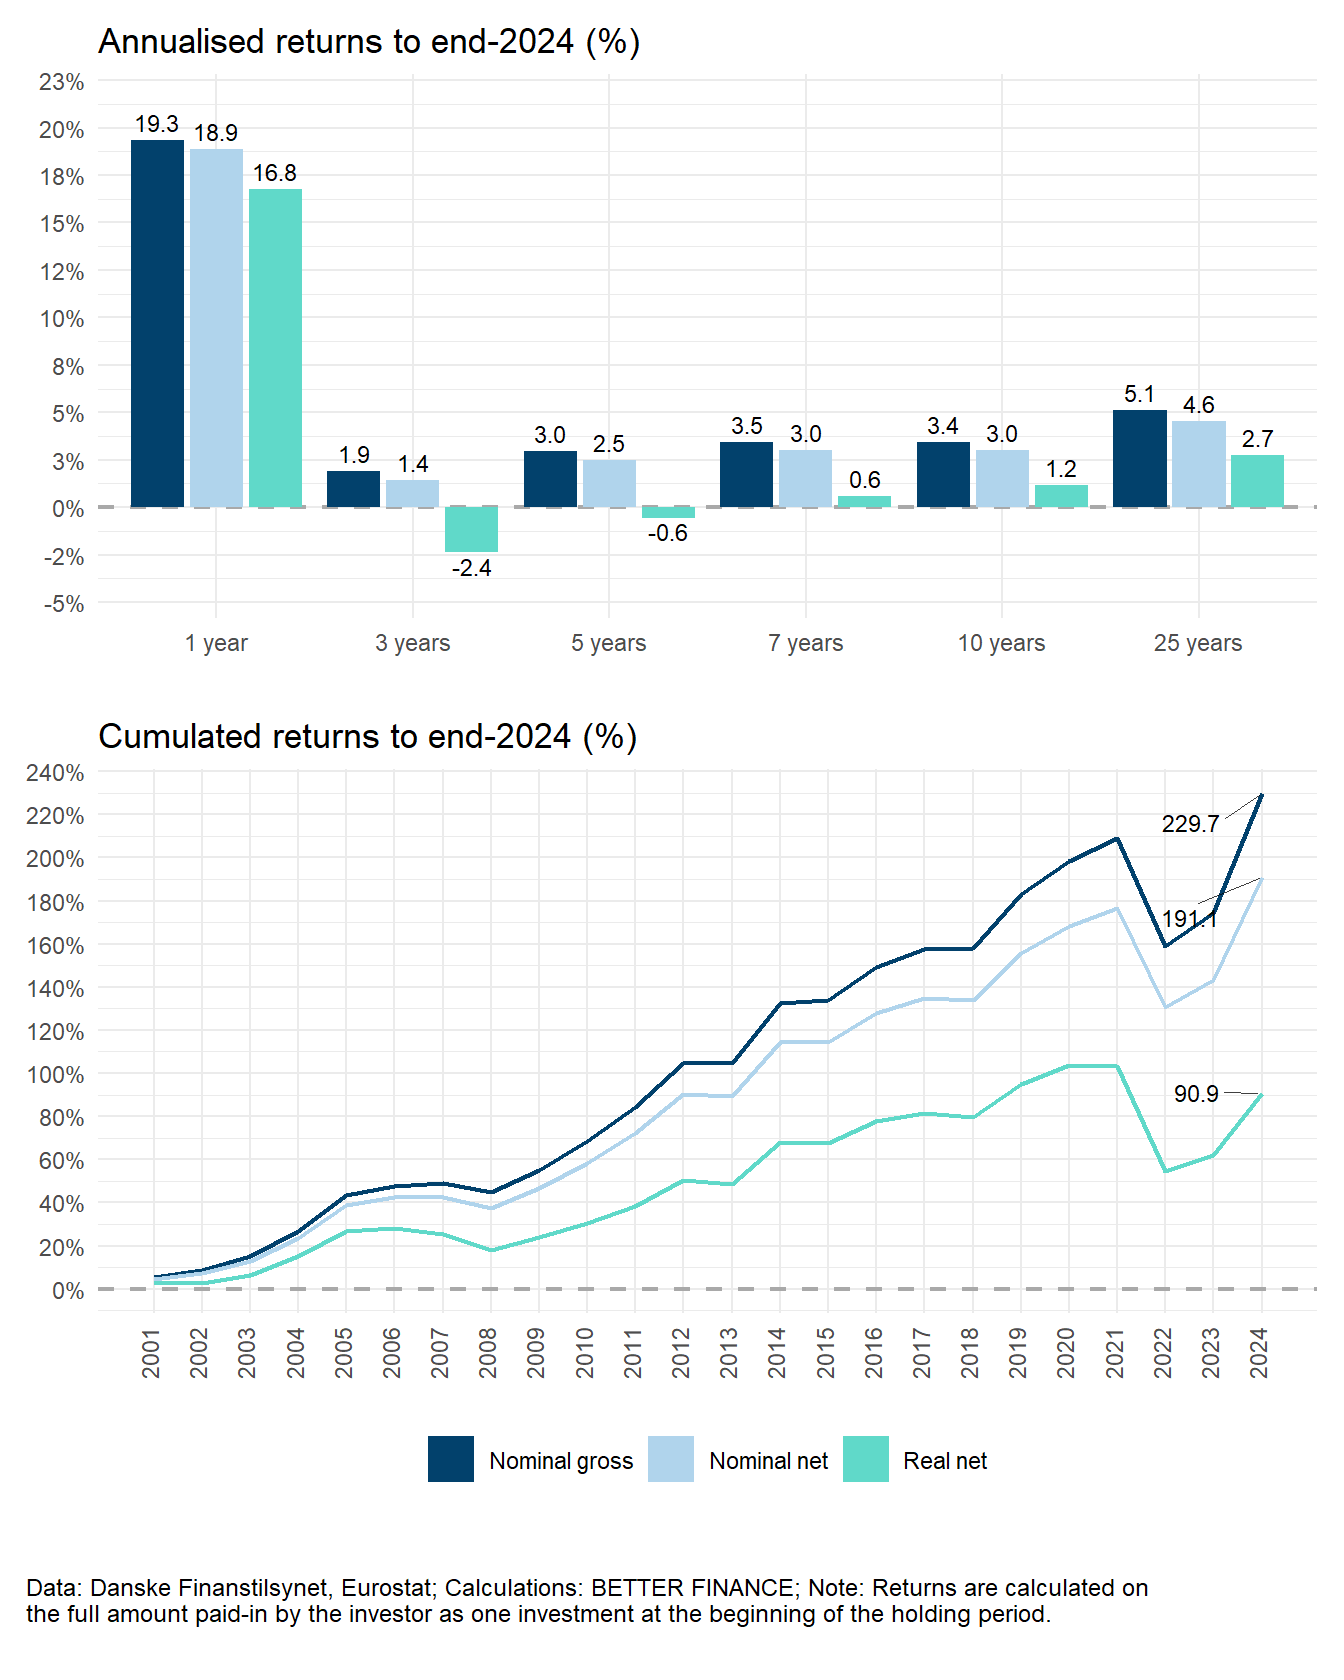
Figure 6.7 illustrates the returns obtained by life insurance policyholders over the period 2000-2024. The generally higher fees of life insurance policies translate into a slightly larger disparity between nominal returns before and after charges. Over the 24-year reporting period, charges reduce average annual performance by 0.6 p.p.s, which, in cumulative terms amounts to a 35.2 p.p.s reduction in returns. Once again, inflation is the main factor that depresses long-term returns: over the 24-year holding period, it reduces the nominal net annual average of 4% to just 2.2%, resulting in a 89 p.p.s reduction in performance over the period.
Finally, and although they represent a mere 1% of total Danish pension savings, we compute the returns of company pension funds, displayed in Figure 6.8. Even though more data is available, for this edition, we could only compile the data for the years 2016-2024, which show a pattern similar to those of industry-wide pension funds and life insurance: over the eight years, costs have a limited impact on performance (-0.2 p.p. annually, -2.1 p.p.s), while inflation virtually wipes away all performance (-2 p.p.s annually, -17.5 p.p.s cumulated), leaving members of those funds with a meagre +1.7% real net return.
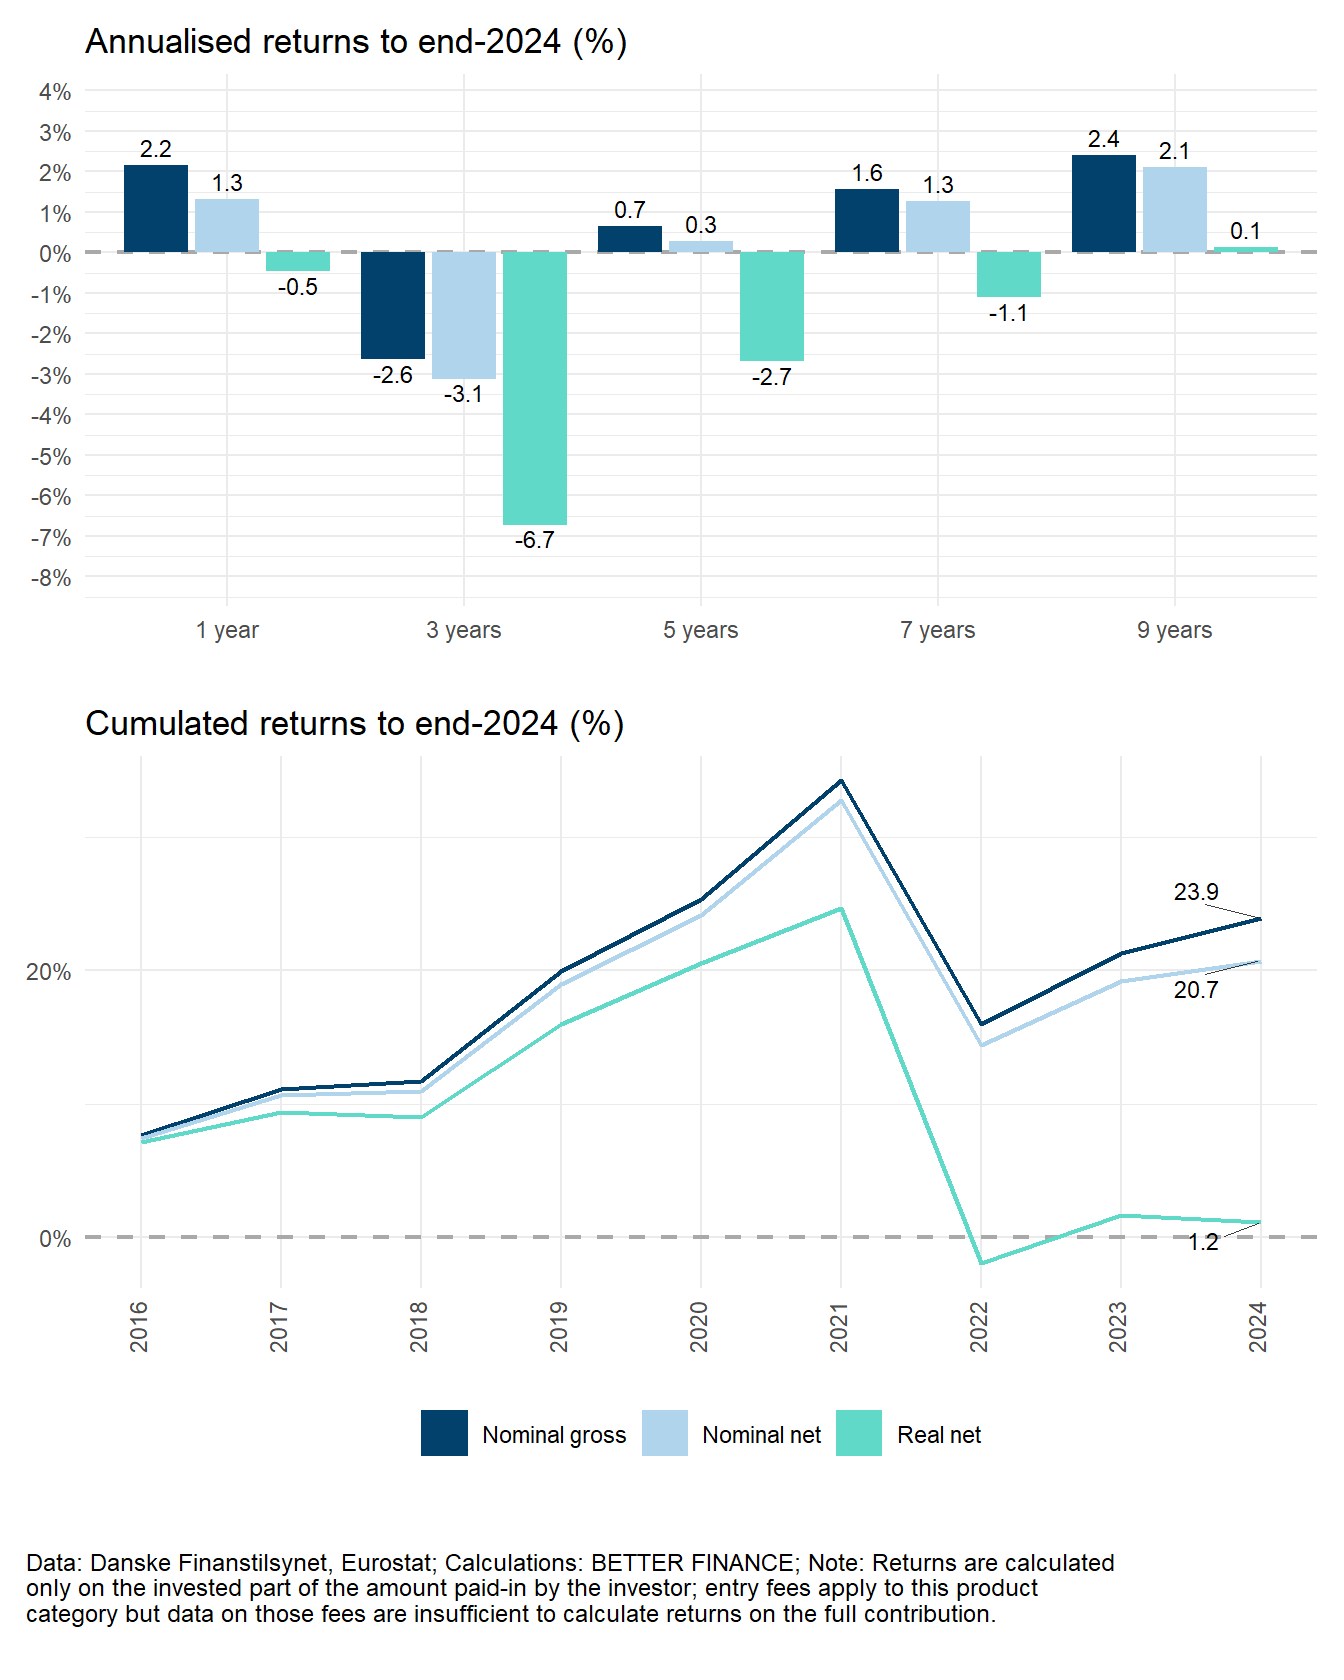
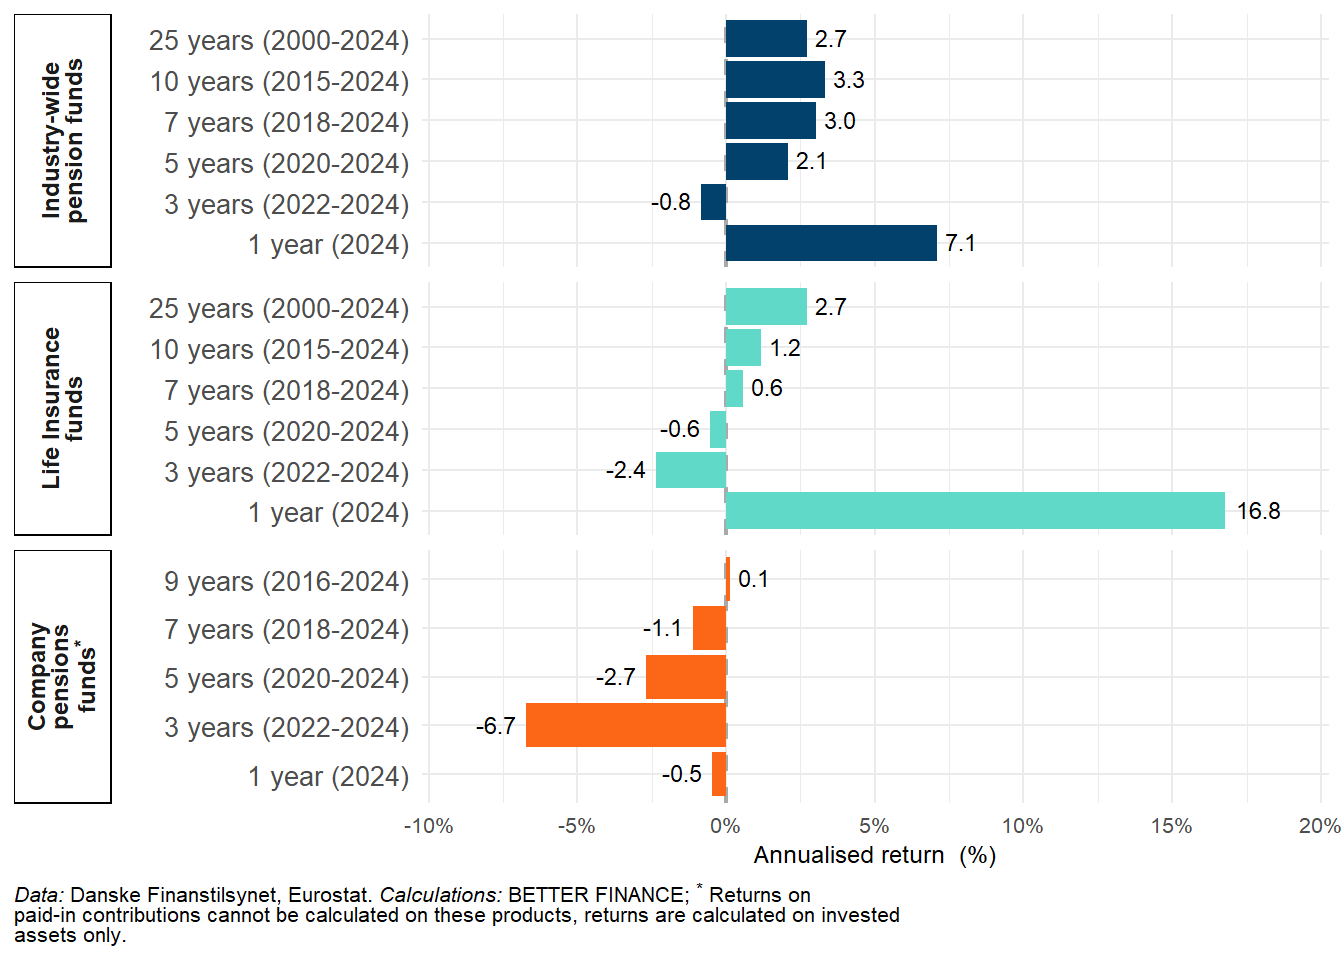
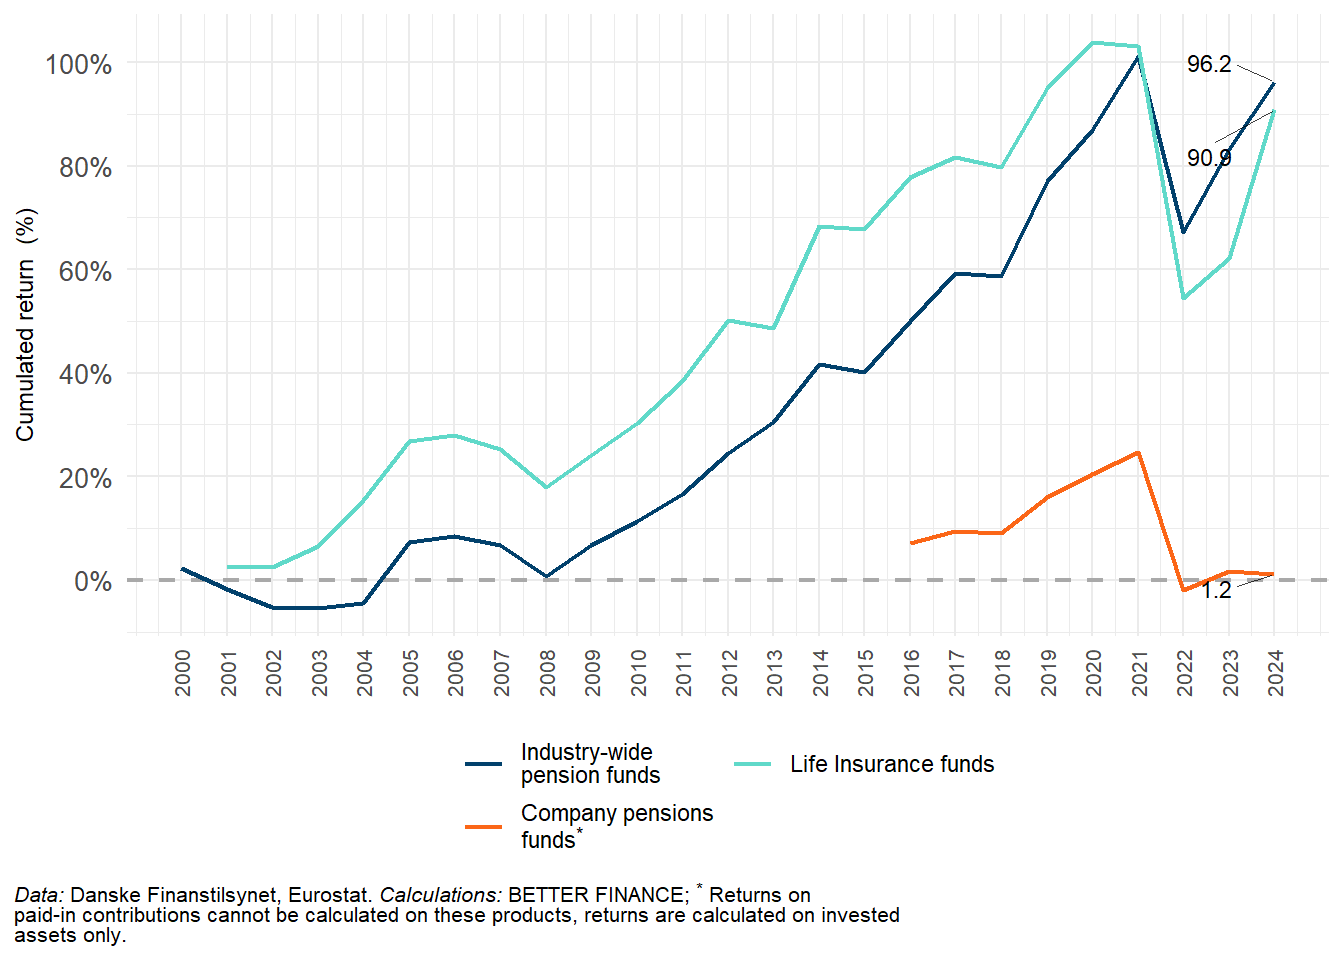
Figure 6.9 and Figure 6.10 compare the annualised and cumulated returns of the three product categories. The comparison shows how similar the performance of industry-wide funds and life insurance, with very close annualised real net returns over 24 years (+2.6% and +2.2%, respectively), and generally similar evolution of cumulated returns from 2004 to 2021. The losses of industry-wide funds in the early 2000s left them behind life insurance for most of the period, until 2022, when the greater exposure of life insurance to capital markets led to greater losses that wiped away the superior returns of those contracts.
The various pension and life insurance companies generally employ slightly different investment strategies and asset compositions, as shown in Figure 6.11, Figure 6.12 and Figure 6.13.
| Equity index | Bonds index | Start year | Allocation | |
|---|---|---|---|---|
| Industry-wide pension funds | STOXX All Europe Total Market | Barclays Pan-European Aggregate Index | 2000 | 50%–50% |
| Life Insurance funds | STOXX All Europe Total Market | Barclays Pan-European Aggregate Index | 2000 | 50%–50% |
| Company pensions funds | STOXX All Europe Total Market | Barclays Pan-European Aggregate Index | 2016 | 50%–50% |
| Data: STOXX, Bloomberg; Note: Benchmark porfolios are rebalanced annually. | ||||
Industry-based pension funds typically focus on achieving high returns with the lowest possible risk, and they have succeeded in this approach. This group includes PensionDanmark and Industriens Pension, both ranked among the top 10 by market share. Industriens Pension has, for many years, achieved some of the industry’s highest long-term returns.
Many of these funds — notably the largest, PensionDanmark — are making a significant effort for the climate, driven both by a desire to ensure long-term returns for their members and a responsibility to contribute to the green transition. They have been pioneers in the Danish pension sector, making large, direct investments in renewable energy and green infrastructure, often delivering strong and stable returns. PFA, as Denmark’s largest commercial pension company, has also intensified its sustainability efforts, although its customer-owned structure distinguishes it from the purely industry-based funds.
In general, PensionDanmark maintains a low-risk and stable investment strategy, well suited to the broader labour market. The fund holds a high proportion of “related undertakings” and only around 15–18% of its assets in bonds.
In recent years, however, Danish pension funds — including PensionDanmark and Industriens Pension — have reduced their holdings of Danish equities and increasingly directed their green and alternative investments towards international markets, seeking broader diversification and stronger, risk-adjusted returns.
The Company pensions funds, which represent a very small share of the total pension market (approximately 0.9%) have steadily declined over many years. They are often closed to new members, and existing members are typically transferred to other corporate schemes. As a result, many company pension funds now primarily consist of members receiving pension benefits, which naturally influences their asset allocation. As shown in the figure, they typically hold the majority of their assets in secure bonds and investment funds.
Life insurance companies also hold a significant amount of bonds to meet their insurance obligations, with listed equities playing an important role. Their investment strategy strongly prioritises safeguarding customers’ best interests. Notably, most life insurance companies also offer standard pension schemes, a category that includes the four largest pension companies in Denmark.
Do Danish savings products beat capital markets?
In this last section, we compare the computed returns to the “default” 50% equity–50% bond benchmark portfolio presented in the introductory chapter of the report.
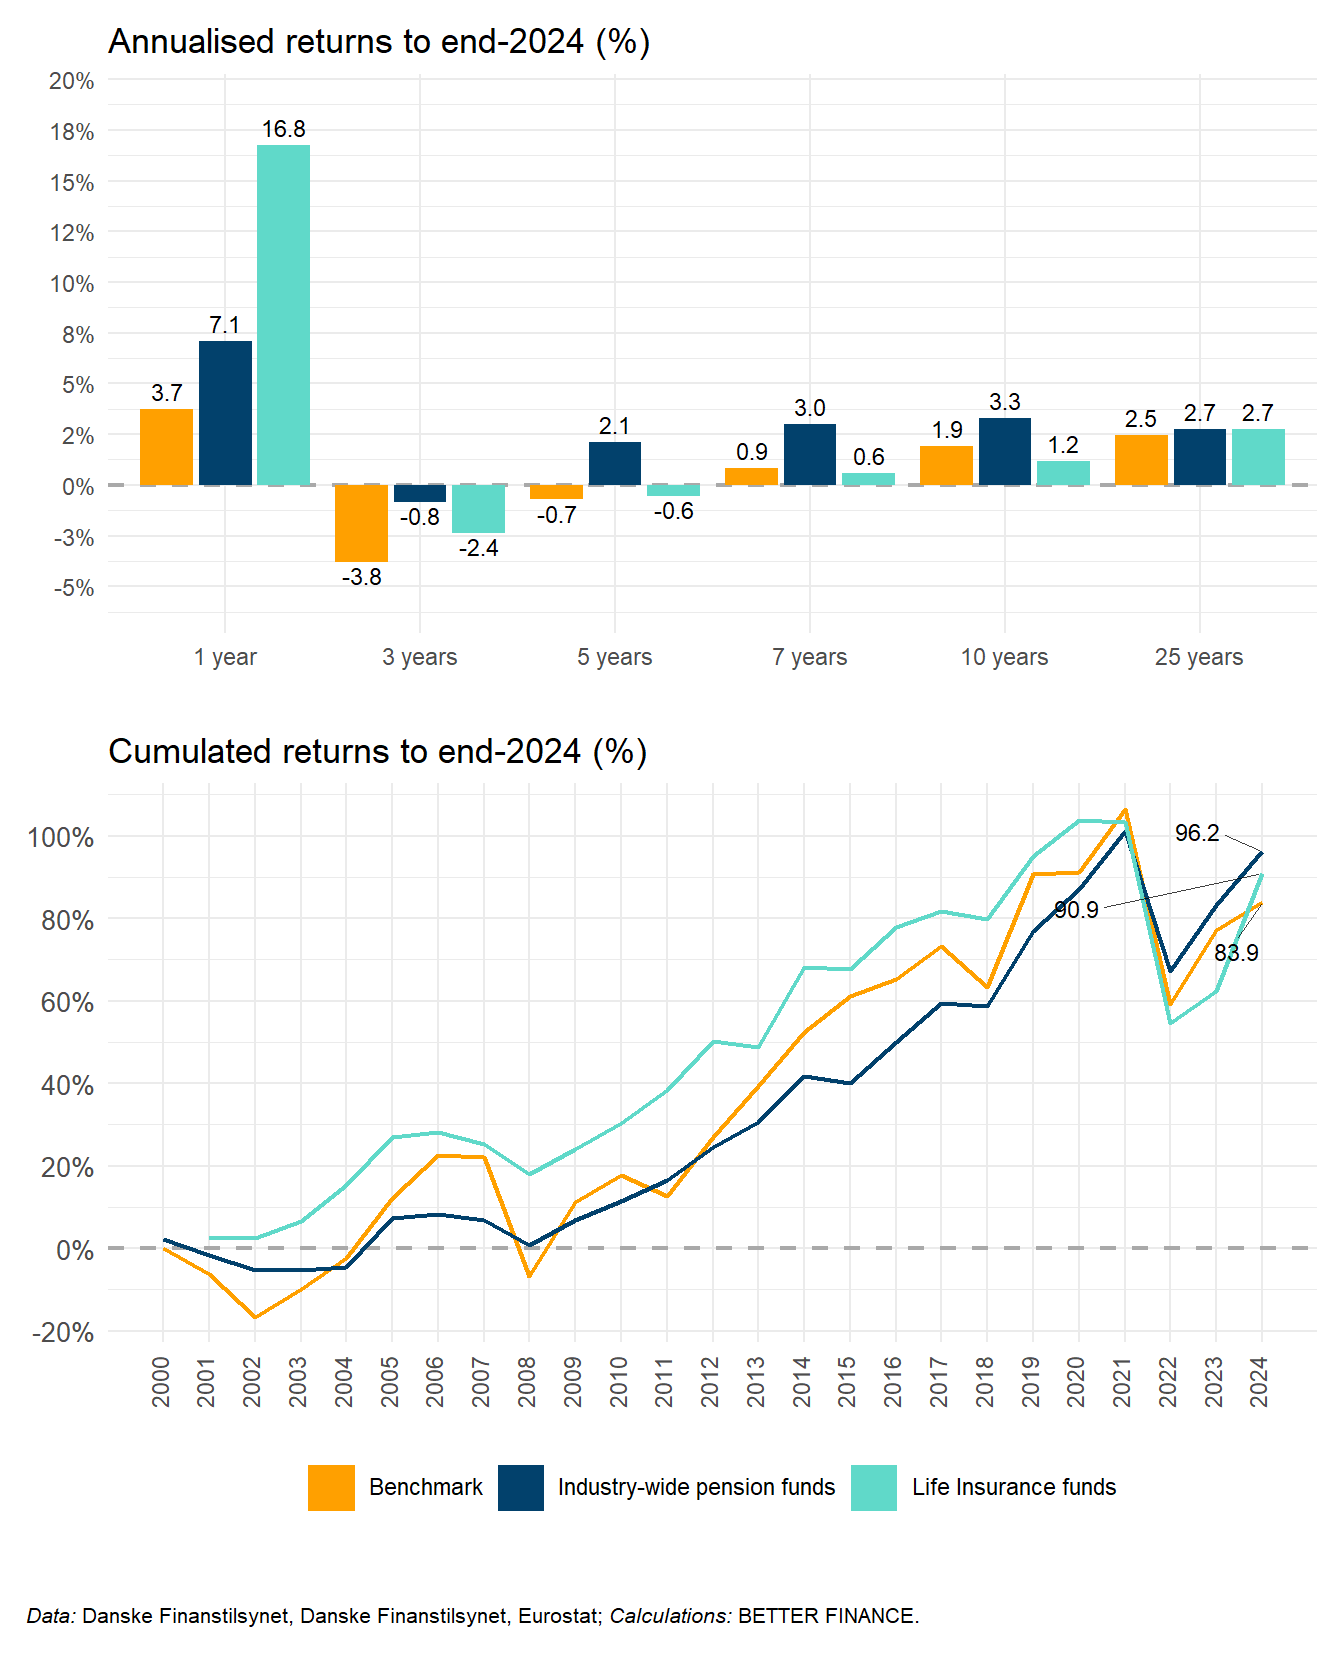
The comparison is favourable for industry wide pension funds (Figure 6.14): With the exception of the 1-year period, these funds consistently outperform the benchmark. Over 24 years, they deliver a cumulative real net terms that exceeds the capital market benchmark by 6 p.p.s.
The comparison is slightly less flattering for life insurance funds, that fail to beat the benchmark over all holding periods, although by a short margin: -0.2 p.p. in average annual real net performance over 24 years, amounting to a 10.4 p.p.s difference in cumulated terms.
Recent analysis by Danmarks Nationalbank (2025) confirms that Danish pension schemes—particularly unit-linked and collective funds without guarantees—have generated average annual nominal returns of around 6 % since 2016, broadly in line with or slightly above a 50/50 equity-bond benchmark. Over the long term, their risk-adjusted performance remains highly competitive with capital-market returns, thanks to diversification across global equities, infrastructure, and alternative assets.
6.6 Conclusions
The Danish pension system remains one of the strongest and most sustainable globally, consistently ranked in the A-tier of the Melbourne Mercer Global Pension Index 2024. This reflects both financial stability and a broad political consensus that has enabled continuous adaptation to demographic and market developments.
The three-pillar system combines tax-financed public pensions with funded occupational and private schemes, ensuring high coverage and replacement rates. Nine out of ten Danes now have an occupational pension, and most employers contribute through collective or company agreements. By 2030–2040, labour market pension payments are expected to exceed those from the national pension.
Public finances meet long-term sustainability criteria, and no major reforms are currently needed. However, challenges persist — particularly maintaining incentives to save and work longer, addressing groups still outside occupational pension coverage, and adapting to longer life expectancy.
A central issue concerns whether the statutory retirement age should continue to rise in line with life expectancy. In May 2025, the governing Social Democrats announced they would no longer support further automatic increases, breaking with a long-standing consensus. The other coalition parties—Venstre and the Moderates—wish to maintain the link, seeing it as vital for fiscal sustainability, though they also advocate a more flexible, socially balanced approach. This debate is expected to dominate the political agenda ahead of the next parliamentary election.
To support longer working lives, several reforms have strengthened economic incentives. Since 2024, employment income is no longer offset against the public pension (Folkepension), and a tax-free senior premium introduced in 2019 rewards continued employment after pension age. Eligible workers born in 1954 or later receive lump sums after one and two years of post-retirement work (DKK 48 555 and 28 902 in 2025), with planned increases from 2026. Together, these measures have significantly improved incentives to remain in the labour market. According to the Danish Agency for Labour Market and Recruitment, the number of Danes working beyond pension age has risen by 22 % since 2022, underscoring their effectiveness.
Total Danish pension assets exceed 200% of gross domestic product (GDP). After the downturn in 2022, markets rebounded in 2023–2024: Danes contributed DKK 159 billion (EUR 21.2 billion) in 2024—a 4.7 % increase—and the sector generated EUR 46 billion in returns. Historically high returns and strong funding have reinforced public confidence, though a “new normal” of lower real returns may require greater risk-taking. Danish pension funds have already expanded their global equity, infrastructure, and alternative investments while keeping costs low. Ensuring sound governance and transparency remains essential to safeguard members’ interests in a mandatory, highly funded system.
Acronyms
- ATP
- Arbejdsmarkedets Tillægspension
- AuM
- assets under management
- DB
- Defined benefits
- DC
- Defined contributions
- ETT
- Exempt Taxed Taxed
- EU
- European Union
- GDP
- gross domestic product
- HICP
- harmonised index of consumer prices
- OECD
- Organisation for Economic Co-operation and Development
- TTE
- Taxed Taxed Exempt
- p.p.
- percentage point
Collective agreements cover a large part of the labour market. There is a long-standing tradition of tripartite consultations between the government, unions and employers’ organisations, with labour market issues generally settled by collective agreement rather than by law. The establishment of occupational pensions is an example of this. An agreement of the three parties was made in 1987, marking the beginning of the gradual introduction of occupational pension schemes to large parts of the private labour market (most public employees were already covered)↩︎
Type I: Age below 40, annual contribution DKK 30 000, assets= 0, Type II: Age 40-55, annual contribution DKK 30-80000, assets DKK 500 000, Type III: Age above 55, annual contribution at least DKK 80 000, Assets DKK 2. mio.↩︎