Much has changed since we published the 2024 edition of this report; so much in fact, that it is at times hard to recognise the world we live in. But two solid anchors remain: the generally disappointing long-term performance of European supplementary pensions, and our commitment to report it.
True, as financial years go, 2024 was fine: The STOXX All Europe Total Market equity index went up 8.76%, and Bloomberg’s Pan-European Aggregate bonds index increased, though more modestly, by 2.46%. It is a far cry from 2023’s performence (+16.18% for equity, + 7.49% for bonds), but should help investors’ portfolios recover from 2022, when both equity and bond markets fell by 12.17% and 18.93%, respectively. Equally true, there are pension schemes in Europe that manage to pass on the good performance of capital markets to their participants—the case of Sweden’s Premium pensions and the good first results of the Pan-European Personal Pension (PEPP) in Slovakia and Poland are, in this sense, encouraging—but these constitute a minority of the products we keep monitoring in this report, year in, year out.
One swallow does not make a summer, as they say: The overall good performance of European supplementary pensions over the past two years should not make us forget that, over the long-term (a decade or more), many products fail to beat the performance of even a conservative portfolio of 50% European equity and 50% European bonds (based on the two aforementioned indices, see Section 1.2.4 below). Worse, of the 35 product categories for which we have at least 10 years of data, 5 fail to beat inflation: the savings of participants in those schemes actually lost purchasing power. Where is the value for money in that?
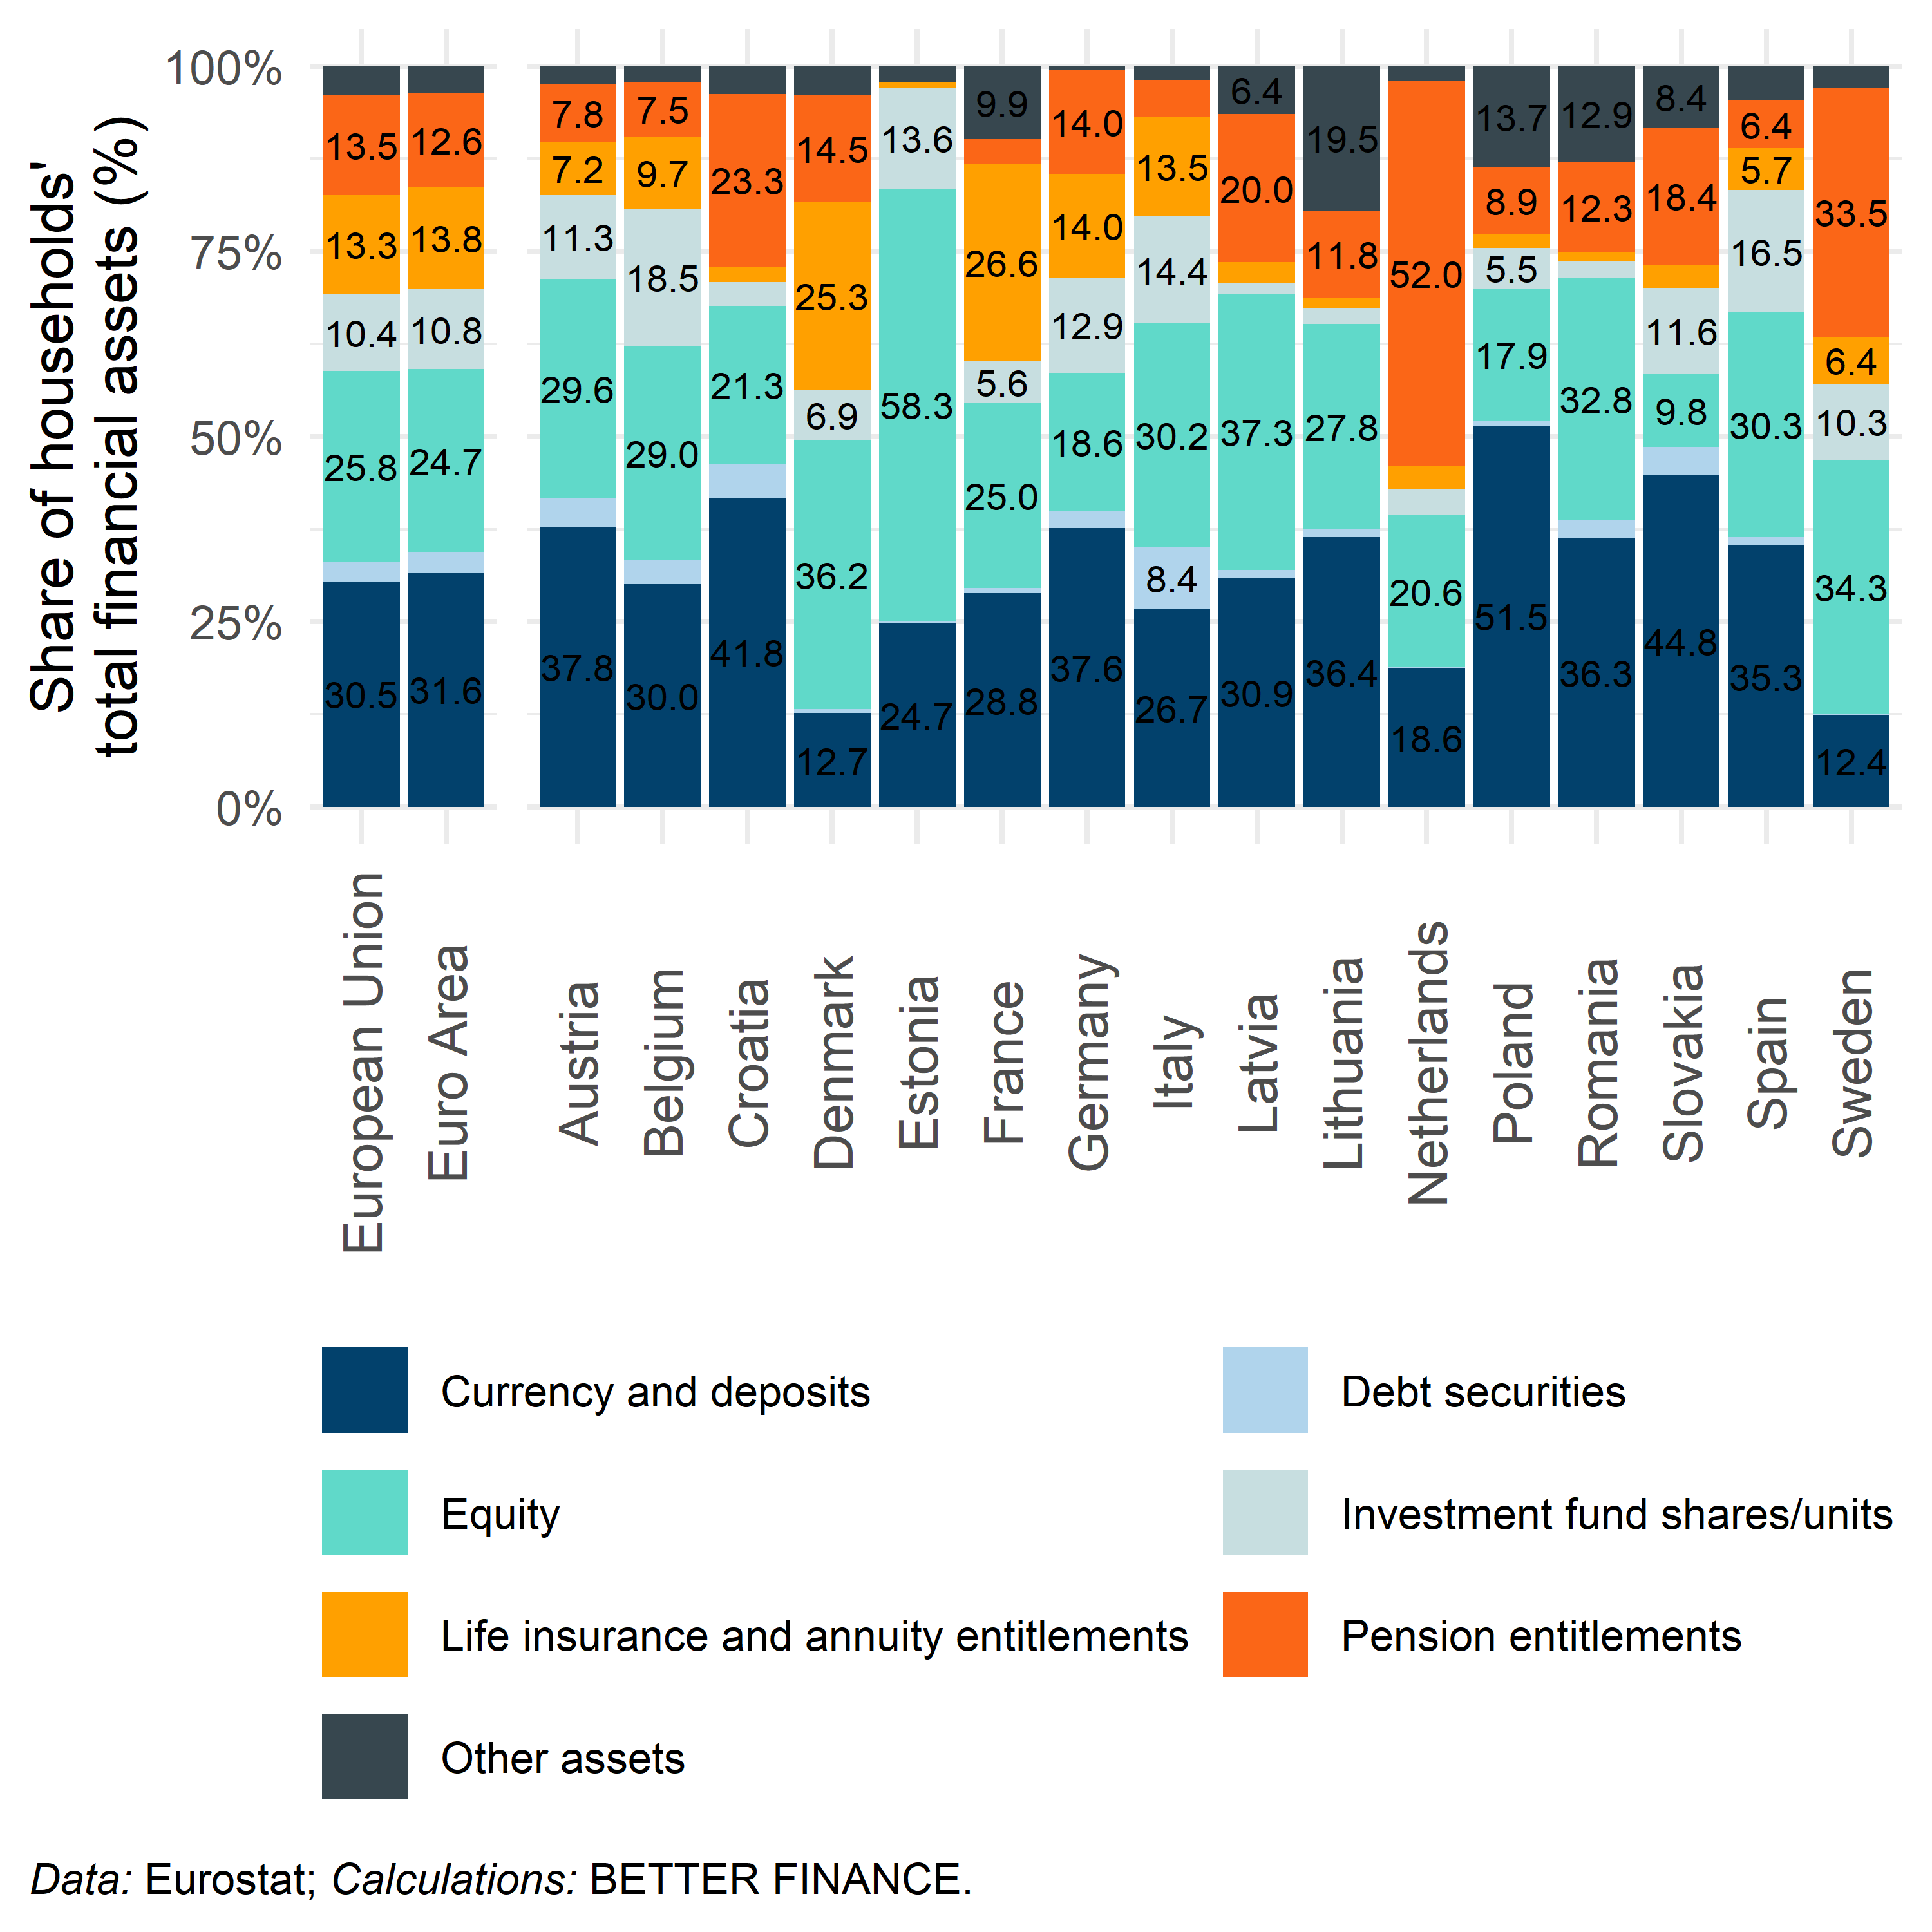
At BETTER FINANCE, we see it as our mission to provide research to support our advocacy efforts towards simple, transparent and performing investment and savings opportunities across Europe; our vision is one of a Europe where individuals can confidently and safely access simple, long-term, efficient financial services.1 On January 1st, 2024, more than a quarter of European households’ financial assets were invested in life insurance and supplementary pension schemes in January 2024 (see Figure 1.1). Monitoring the performance of these long-term savings and investments vehicles and reporting on their shortcomings is, therefore, a crucial part of our mission. This is why, for the past thirteen years, we gathered a motivated team of policy experts, academics and consumer right advocated to bring evidence of the global inadequacy of Europe’s supplementary pensions and other long-term investment products and to testify of how unprepared they are to compensate for the expected decline in public pension benefits and ensure a decent income in retirement for Europeans.
Europeans invest little of their savings, as we can see from Figure 1.1, a large part of European’s savings sleep quietly in the form of deposits with banks. In spite of the low interest they get on these deposits, which, once we account for the fees banks and the inflation that slowly but surely erodes the value of monetary assets, a third of households’ financial wealth is kept as deposits.
What is this a sign of? Lack of foresight? Certainly not: Europeans may not be great investors but they definitely are great savers. After hearing for decades of population ageing and the strain it is sure to put on public pensions, we can assume that most of our fellow citizens have at least some notion that there is trouble down the road with pensions. This is confirmed by the responses to the Eurobarometer flash survey the European Insurance and Occupational Pensions Authority (EIOPA) commissioned in 2024 about consumer trends in insurance and pension services (European Insurance and Occupational Pensions Authority 2024), where, asked whether they will have enough money to live comfortably through their retirement years, 53% replied negatively (57% amongst women, 48% amongst men), and only 8% of those who indicated not having a personal pension product said this is because the state pension is enough, and 8% responded this is because their occupational pension is enough. These responses do not exactly convey the image of a population living in blissful ignorance of the grim future that awaits it.
By contrast, 28% of those who do not have a personal pension product said it is because they cannot afford it. Asked, in another question of the survey, whether they believe insurance-based investment products (IBIPs) and private personal pensions provide value for money, 36% and 29%, respectively, of those who expressed an opinion disagreed.2 41% said they “tend not to trust” or “do not trust” at all insurers to “ensure a good consumer outcome, as well as an adequate retirement outcome” of private pension plans, 32% distrust pension funds (excluding state pension funds, which may be warranted when considering Sweden’s AP7 Såfa, maybe less so when considering Denmark’s ATP, see Chapter 18 and Chapter 6 in the second part of this report).
In a recent study, European Financial Planning Association (2025) highlighted the knowledge gaps and confidence discrepancies that Europeans (lack of) financial planning habits reveal. These, in turn, limit the feeling of control that Europeans have over their personal finances, especially as regards the opportunity for them to invest in complex financial products, including life insurances and personal pension schemes. In short Europeans know they know little about long-term financial planning, but they are increasingly aware that they need to do something about it.
A lost of worries and mistrust, then, compounded by a cruel lack of financial literacy. The ambition of this report is to contribute to raise awareness about the importance of financial planning where this remains necessary, but also to dispel the cloud of ignorance about the various elements of the pension systems of European countries—the various “Pillars” and their respective institutions—and the factors affecting the performance of long-term savings, inter alia, asset allocation, costs, taxation and inflation.
This report should be an empowering tool in pension savers’ toolbox. It should equip them with the necessary information to navigate their own pension system, to understand who does what and to assess the performance of the supplementary pension providers.
We do not see long-term and pension savers as passive consumers; instead, as member-based organisations representing the voice of retail investors in European and national political and policy debates, BETTER FINANCE and its member organisations see investors in pension and other long-term retail investment products as active citizens who express their preferences through their investment choices and through engagement with policymakers. This report is also a tools for that: We take the perspective of the pension scheme participants—What are the costs they bear? What is the return they can expect?—to balance the provider perspective on supplementary pensions with an investor-centric approach. Over the years and the iterations of reports in this series, we have seen a growing interest of policymakers for our analyses and conclusions and we are both proud and happy to see that investor-centric approach at the core of several recent publications from the European supervisory agencies (ESAs), including EIOPA’s work on Value for Money supervision, the European Securities and Markets Authority (ESMA)’s report on “the total cost of investing in funds” (European Securities and Markets Authority 2025) and, crucially, the “Supplementary pensions package”3 that the European Commission submitted to the co-legislators of the European Union (EU) as part of its Savings and Investments Union (SIU) agenda (European Commission 2025a).
Pensions have been the focus of regular—and heated—debates across EU Member States and the cause of mass social movements over the past three decades with every reform that national governments enacted (or attempted to enact). Most of these reforms (and related debates) have so far focused on the first pillar of pension systems, the public, statutory pay-as-you-go (PAYG) systems that, in one form or another, form part of the social security system of most European countries. Faced with the perspective of an ageing population and the strain that it is sure to put on any system where the contributions of the current active population pay for the pension benefits of the current retirees, the goal of the reforms have usually (if not always) been to ensure the financial sustainability of these public pensions by reducing and/or delaying the payment of pension benefits.
Supplementary pensions have entered this picture as a potential solution to the the following conundrum: if delaying the retirement age to the extent that would be necessary to ensure the sustainability of public pensions is politically unacceptable to (at least some) populations, then pension benefits must be reduced (openly or silently through lack of indexation on inflation); but if public pension benefits are reduced, how can we ensure that citizens still obtain a sufficient income to maintain their lifestyle in retirement.
In short, then, supplementary pensions are usually considered as a solution to the trade-off between pension sustainability and pension adequacy: make the active population save and invest a part of its current income to grow a capital to draw from in retirement. In the general context of open trade and free flow of capital in which most of the world’s economies evolve, fostering private pension savings, at least theoretically, kills two birds with one stone: not only does it provide an supplementary source of retirement income for citizens reaching retirement age, partially replacing reduced public pension benefits without sacrificing their living standards; it also constitutes a powerful way to direct households’ savings towards capital markets. This effectiveness of this solution, however, relies on the double assumption that individuals will effectively invest for their retirement and that these investments will yield a sufficient return to at least maintain—or, even better, multiply—the value of the initial contributions.
Therein lies the problem.
First, however large the savings of Europeans, retirement is not necessarily their immediate purpose. Affording to buy a house or to pay for the education of one’s children often seems more immediate concerns than the seemingly far away perspective of retirement, which may in part explain why Europeans keep their savings where they remain available at short notice rather than locked away for decades in a pension scheme. Yet, it may well take a lifetime to build a capital that can meaningfully provide a substantial retirement income; saving early and regularly is essential to benefit from compound returns.
Second, even for those Europeans who took to heart the “save early, save enough” mantra, the ability of supplementary pensions to deliver a substantial complement to their retirement income hinges crucially on their ability to deliver positive long-term real net returns, i.e., to increase the value of one’s pension savings, even after we deduct the costs of managing these savings and after we adjust for the eroding effect of inflation. If EU citizens’ pension savings are invested in underperforming assets, the great shift of households’ savings towards capital markets that recent high-level reports have called for (Draghi 2024; Letta 2024) and that the European Union is trying to operate with its SIU agenda (European Commission 2025a) could turn into a dickensian nightmare within only a couple of decades.
The present report focuses on the second of this second part of the double assumption and, unfortunately, shows that it often does not hold. Insufficiently “aggressive” products—investing only or mostly in low risk-low yield instruments—are unlikely to generate sufficient nominal gross returns able to offset the costs of managing assets and administering pensions, compensate for the income reduction induced by the taxation of pension payouts, and compensate for inflation that in the long run, even at moderate levels, significantly reduces the purchasing power of savings.
Across the 47 categories of long-term investment and pension schemes we analyse in 16 EU Member States (see , many barely manage to preserve the purchasing power of their participants over the long term, some even destroy value. Thankfully, though, there are notable exceptions that show that it is possible to provide supplementary pensions individuals can effectively rely on.
Those, BETTER FINANCE and its expert contributors believe, are issues that EU citizens must be made aware of. Building an adequate pension not only requires starting saving early and saving a lot, it also requires asking the right questions to the professionals in charge of collecting and administering one’s occupational pension, and to those distributing voluntary long-term saving products. Generous redistributive pension systems have been an essential part of the European social model in the 20th century, drastically reducing old-age poverty. Now that this model is under the strain of an ageing population, Europeans need to have an informed democratic debate about the management of the funded private pensions if those are to play an effective role in ensuring pension adequacy.

1.1 Our approach
For each of the product category that we analyse, our goal is to determine whether, in fine, the average product in that category is able to increase the purchasing power of one’s savings. In other word, we analyse whether the real net return of that average product is positive. We start with assessing, whenever possible, how the costs charged by pension funds and life insurance providers impact performance: to be blunt, every cent paid in costs is a cent that goes into a financial intermediary’s pocket instead of being reinvested for the final benefit of the investor.
The level of costs in long-term and pension savings products, especially voluntary ones (Pillar III) has attracted some attention from European regulators and supervisors in recent times. Supervisors have issued a number of documents on “value for money supervision”, i.e., detecting retail investment products on the market the performance of which is too low for their level of costs and the product intervention measures that should be taken when such “value for money issues” are detected. (European Insurance and Occupational Pensions Authority 2021, 2022; Financial Conduct Authority 2023; Bundesanstalt für Finanzdienstleistungsaufsicht 2023; European Commission 2023a), a much welcome development that is—unfortunately—only partially feeding into the ongoing trialogue negotiation on the Retail Investment Strategy (RIS) (BETTER FINANCE, BEUC, and Finance Watch 2024).4
In line with our investor-centric approach, we seek to calculate the net return investors obtain from the amount they contribute to the different long-term and pension savings products. To that end, we must account for the effect of entry fees, which are levied on contributions or premia, as well as the effects of product management costs paid annually for the management of the invested assets and administration of the contract.
Entry fees reduce the amount that is effectively invested but are one-off fees, a good performance of the invested assets can compensate even relatively high entry fees. Annual costs are paid every year for the duration of the contract: they accumulate and continually erode the financial return on the invested assets, potentially resulting in negative net returns on years when the return is lower than the annual cost.
In this report, we calculate returns over 1, 3, 5, 7 and 10 years to end-2024, as well as since 2000 or the earliest year for which performance data is available. We assume a single contribution at the beginning of the period, that is, where entry fees apply and data on the level of these entry fees is available, we consider entry fees only on the first year, not on subsequent years of the period. Annual fees, by contrast, are deducted from the nominal gross return for each year of the period.
The second aspect we look at is the effect of inflation. As European Insurance and Occupational Pensions Authority (2020) notes,
the riskiness of a personal pension product is its potential inability to outperform inflation, and so to lose savings in real terms, or not being sufficiently “aggressive” to reach higher investment returns to compensate for potentially low contribution levels
While you save, the average level of prices rises, each year reducing a little more the value of your savings. That is why, throughout this report, we focus on returns after adjusting for inflation, which must be positive if the vehicle one uses to accumulate one’s retirement capital is to at least preserve the purchasing power of one’s savings.
ESMA and EIOPA began reporting on the cost and performance of long-term retail investment and pension products in 2018, answering a request made by the European Commission in its mid-term review of the Capital Markets Union (CMU) action plan (European Commission 2017, 20). The Organisation for Economic Co-operation and Development (OECD) also reports on the returns of pension savings, but limits its analysis to occupational pensions (Pillar II). Although we are proud to say that the Commission’s request to the ESAs directly followed up on BETTER FINANCE’s call to policy-makers (BETTER FINANCE 2015, 27), we believe that our report remains unique and necessary. Our report indeed differs markedly from ESMA and EIOPA’s: Rather than a sample, we assess the average returns across all providers of a product and we do it both for products falling in the real of occupational pensions (Pillar II) and voluntary personal pensions (Pillar III); to the extent possible we calculate average returns before charges and inflation (nominal gross), after charges and before inflation (nominal net) and, of course, after charges and inflation (real net) for backward periods of up to 24 years, thereby enabling savers to consider the evolution of the purchasing power of their pension savings beyond the “money illusion” (Shafir, Diamond, and Tversky 1997). Another notable difference with ESMA and EIOPA’s “cost and past performance” reports is that, while these reports focus on “product costs”, i.e., the ongoing costs of the product themselves, our investor-centric perspective leads us to consider the total cost of investing in the long-term and pension savings products we analyse, including, to the extent possible, all distribution costs such as entry and exit fees.
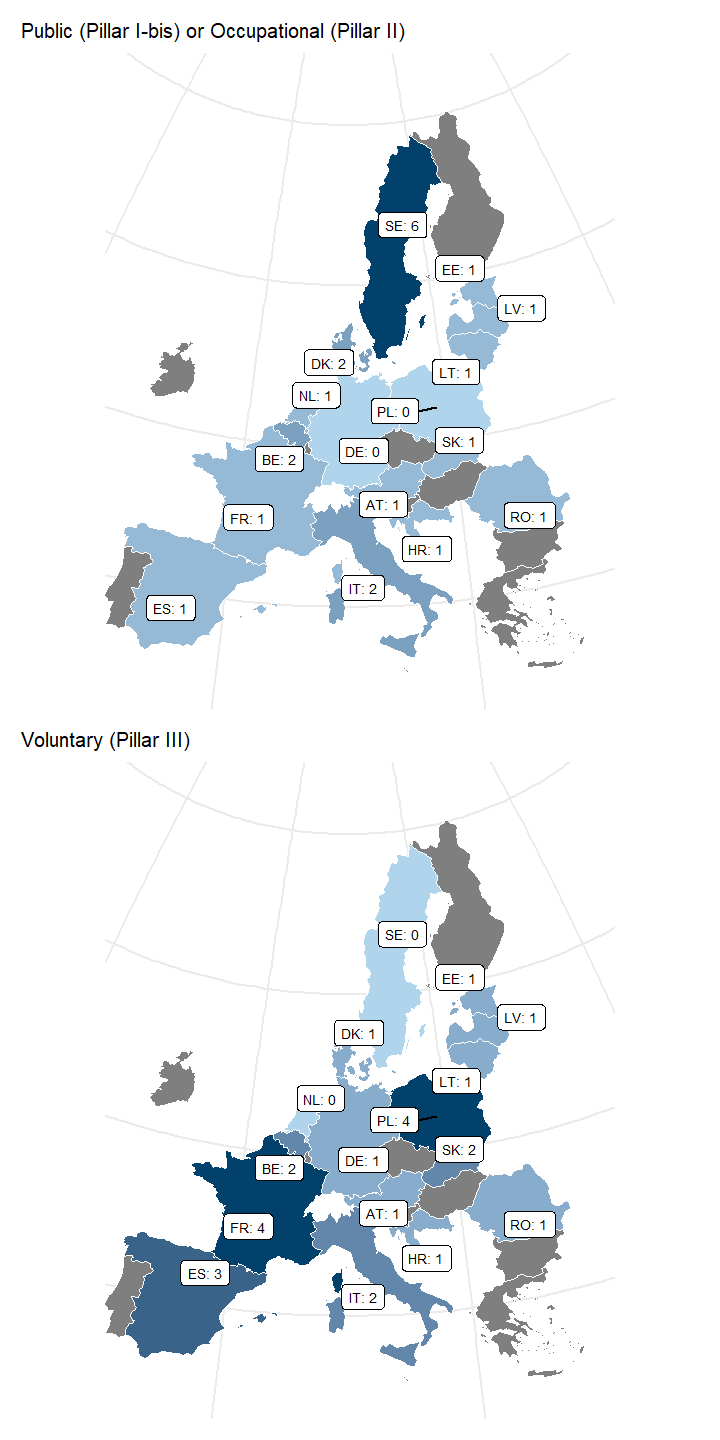
Contrary to ESMA and EIOPA’s reports, we also provide, to the extent this information is available, information about the average allocation of assets within a product category and a description of the national pension systems, including Pillar I State pensions. Finally, because we base our research on publicly available data, our report reveals the strikingly different levels of transparency on costs and performance across countries and product categories. Figure 1.2 and Figure 1.3 display the countries included in our report and the number of analysed product categories in each of them and, in passing, illustrate the structural diversity of EU countries when it comes to supplementary pensions, with countries relying mostly, if not only, on occupational pensions (e.g., Sweden), while others know virtually no other products than voluntary personal pensions (e.g., France).
Cost and charges: Getting value for your money
Collecting pension savings, investing them in capital markets and administering pension benefits as well as advising the most appropriate the most suitable long-term or pension savings product on the market are services that pension scheme providers render to their participants. Those services have costs that must be paid for in one way or another; charging fees for them is, therefore, legitimate but if and only if the fees charged are in line with the services rendered. In other words, supplementary pension schemes should be cost-efficient.
For this report, the contributors seek information on nominal returs, of course, but also information on the average costs and charges levied by the managers of pension savings products. Obtaining these data enable us to assess the extent to which asset management, administrative and other costs reduce the amount of interests and dividends that are being credited to investors’ accounts and reinvested on their behalf. Unfortunately, data on costs and charges are scarce and difficult to compare for many of the product categories analysed in our report, sometimes simply impossible to obtain.
The issue of costs and charges of packaged retail and insurance-based investment products (PRIIPs) (among which personal pension products) have been the subject of heated debates in EU policy circles over the past two years. These debates have been sparked by the European Commission (EC)’s legislative proposals for a RIS, including new proposed rules on the identification and quantification of costs, how these must be disclosed to retail investors, and the assessment of their proportionality to the expected benefits (European Commission 2023b). BETTER FINANCE has strongly supported these proposals, which we saw as an important step towards empowerment of retail investors (BETTER FINANCE 2023), and expressed its disappointment with the provisional outcome of the ensuing legislative work of the European Parliament and Council BETTER FINANCE, BEUC, and Finance Watch (2024).
Inflation: The silent performance killer
Inflation came back to haunt European savers with a series of commodity price shocks and supply chain disruptions which affected, primarily, energy and food prices globally from the beginning of 2021, further compounded by the Russian military aggression of Ukraine (Aldama, Le Bihan, and Le Gall 2024). Average inflation in the EU—which had been below the 2% threshold that is the European Central Bank (ECB)’s operational definition of price stability (European Central Bank 2024)—rose to 5.31\% in 2021 and peaked at 10.4% in 2022, prompting the ESAs to produce a fact sheet alerting savers and investors that “inflation may impact your financial situation and reduce your purchasing power now and in the long term” (European Supervisory Agencies 2023).
Inflation receded in 2023 and 2024, stabilising to a level similar to that of the early 2010s. Nevertheless, the ESAs’ warning about the effect of inflation on the purchasing power of long-term savings remain as valid in times of “stable” prices as in times of high inflation. As can be seen in the lower pane of Figure 1.4, cumulated inflation over the period 2000–2020 (an extended period of relative “price stability” by the ECB’s definition) already amounted to over 40%; the 2021-2022 inflation fever merely aggravated an existing issue for long-term and pension investors.
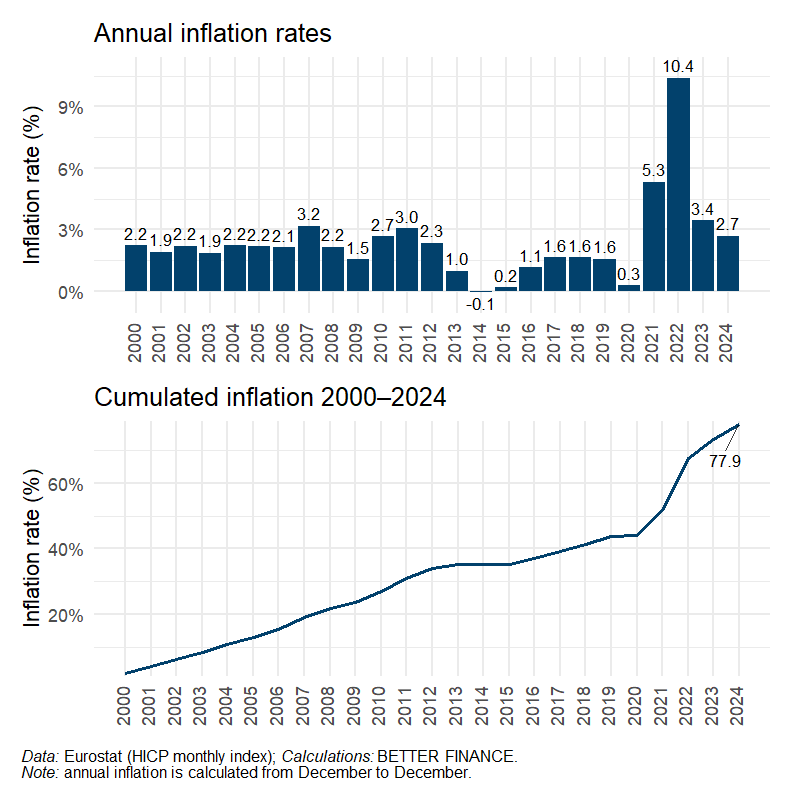
Average inflation in the EU over the period 2000–2020 was actually “only” 1.75% per year—leading the ECB to implement an accommodating monetary policy, maintaining ultra-low interest rates—amounting to a 44.1% reduction in purchasing power of each euro over two decades. Then, even without considering the “anomaly” that the years 2021–2022 may constitute in a trajectory of otherwise low inflation, any long-term or pension saving product would have to have returns over 1.75% per year (i.e. cumulated returns above 44.07%) over the period 2000-2020 for the investor not to have lost any money, in real terms, on their investment. As the remainder of this report will show, that is already a benchmark that a preoccupying number of long-term and pension saving products failed to beat.
1.2 Our methodology
In this section, we briefly present the methodology that BETTER FINANCE and its expert contributors follow to analyse the real return of long-term and pension saving products. Despite the great diversity of the European pension saving landscape, we strive to follow a common approach in order to make our results as sound and comparable as possible.
Scope
The objective of this research is to report on the real costs and performances of all financial products used by EU citizens for long-term and pension savings purposes. Beyond pension schemes and the related “pension vehicles” they rely on—institutions for occupational retirement provision (IORPs) or pension insurance—, this potentially also includes financial products not specifically dedicated to pension savings but which are often used for this purpose—such as life insurance in France—or particular bank savings accounts in several countries.
The analysis, computation and presentation of costs and performances—the real net returns—is done at the product-category level. Where the computation is not possible at the product-category level, then it is at least done at the Pillar level. Each product category analysed in the report is classified as either an occupational (Pillar II) or voluntary (Pillar III) pension product following the conceptual framework progressively defined by the World Bank since the mid 1980s (World Bank 2008). There are only two exceptions to this approach in the report: Sweden’s Premium pensions (AP7 Såfa and other funds), which, though funded and earnings-based are classified as State pensions (Pillar I, or “Pillar I bis”), and; France’s insurance-based pension saving products (IBPPs) a category that, although mostly composed of voluntary products, also includes some occupational pension products and is therefore classified here as Mixed (II/III). State redistributive, PAYG pension systems are briefly presented for information purposes in the introduction of each country case in the second part of the report but are not analysed in terms of cost and performance.
Data sources
To establish the report, the contributors have relied on data that is publicly available, either published in aggregated form by national competent authorities (NCAs) and trade associations representing pension funds, life insurance and other providers of long-term and pension saving products.
Neither BETTER FINANCE nor its expert contributors produce any of the data or information presented in the report. The report is entirely based on publicly available information, and no private data sources or licences—that are not available for any reader—are used in elaborating this report.
Elaborating the report on the basis of publicly available data alone pursues a threefold purpose:
First, we wish to demonstrate to public authorities, especially to regulatory and supervisory authorities, that such computations can be done without access to commercial databases, licences or non-public information, where and when product providers adopt a coherent and comprehensive information disclosure framework. By contrast, we also highlight the need to improve disclosure of information in the countries and for the product categories where data is not fully available.
Second, we wish to enable non-professional savers to understand how and where they can find all necessary information on the real returns of their pension savings in order to engage more and make informed decisions.
Third, and last, we wish to make our results as transparent as possible and facilitate external reviews of the report. To this end, BETTER FINANCE maintains a record of all “raw” data, computations, and results for the entire report, including the individual country cases.
Producing our report on that basis constitutes a particularly tough challenge considering the scarcity of such publicly available data, as already noted above. Comprehensive historical data is often missing, breaks in time series sometimes force our contributors to extrapolate missing data, and incomplete cost data often lead to overestimated net returns calculations.
Calculating the real return
Throughout this report, we follow the hypothetical scenario of an investor making a single initial payment into a long-term or pension scheme, without any subsequent contribution. The calculation of the real net returns of long-term and pension saving products is done in several steps based on the above-mentioned data.
First, all amounts in currencies other than the euro are converted to euros using the ECB’s euro foreign exchange reference rates taken on the last working day of each year.6
Second, we consider the available cost data and performance data in order to compute nominal gross and nominal net returns on the basis of the data disclosed by NCAs, trade associations or other institutions. We list nine common cost metrics that we believe should—as a minimum—be reported by all long-term and pension saving vehicles at individual and aggregate level:
Entry fees (either contribution fees or acquisition) as a percentage of contributions;
Ongoing investment administration and management fees (related to the cost of investing assets on capital markets) as percentage of total assets;
Ongoing flat fees charged for the management of the contract or pension;
Other ongoing fees not already included in the administration and management fees;
Performance fees or success fees, in relation with overperformance of the product compared to its benchmark;
Exit fees, i.e, fees charged on amounts withdrawn from the account;
Other non-recurrent;
Total expense ratio (TER); and
Reduction-in-yield (RiY).
In each country and for each category of pension saving products, the contributors seek information on these metrics at aggregate level in order to obtain, for each year, the average level of costs and charges by which nominal gross returns are reduced. Where sufficient data on the average annual costs of products in the category are available, we calculate the nominal gross and nominal net return on invested assets: where the performance figures disclosed by the NCA, trade association or other institutional source are gross of costs and charges, we deduct the total annual cost figure—expressed, like the performance figures, as a percentage of assets under management (AuM)—from the disclosed rate of return to obtain the nominal net return; where the disclosed performance figures are net of costs and charges, we conversely add the annual costs figure to compute the nominal gross return. Considering the scarcity of costs and charges data, and the variety of ways in which those available are presented, this step varies from one product category to the next. Contributors to the report first check whether any cost item is already deducted from the return figures disclosed by NCAs or industry bodies and, if so, which, in order not to double-count any cost item. They then calculate the total of the remaining ongoing charges as a percentage of assets and subtract this figure from or add it to, as appropriate, the disclosed return.
To obtain the rate of return not merely on invested assets but on contributions—the amount actually paid into the scheme by participants—we consider whether entry fees apply. If not, the return on contributions is equal to the return on invested assets: without entry fees (or acquisition costs), the paid-in amount is entirely invested. If entry fees apply and if we have sufficient data about the level of these entry fees, we adjust the nominal gross return by a factor \(1 - \text{fee}_\text{entry}\) where \(\text{fee}_\text{entry}\) is the entry fee expressed as a percentage of contributions or premia. This reflects the fact that where entry fees apply, only a part of the contributions are invested and generate financial returns. The formula for the annual return on contributions \(r_{contribution}\) on any given year, where the annual return on invested assets is \(r_{invest}\) is therefore:
\[ r_{contribution} = (1-fee_{entry})\times(1+r_{invest})-1 \]
Third, annual returns net of charge are adjusted for inflation—*real net* returns—in order to evaluate the actual evolution of the purchasing power of the investment. Annual inflation rates are calculated for each country in the report based on Eurostat’s monthly harmonised index of consumer prices (HICP), taking for each year the December value of the HICP for the corresponding country. Annual inflation rates are calculated as:
\[ i = \frac{HICP_{y^{n}}^{m12} - HICP_{y^{n-1}}^{m12}}{HICP_{y^{n-1}}^{m12}} \]
where, for any given country, \(i\) is the annual inflation rate in year \(n\), and \(HICP y_{n}^{m12}\) represents the monthly HICP published by Eurostat in December of year \(n\).7
Nominal net returns are then adjusted for inflation to obtain the evolution of the purchasing power of the investment. To obtain the annual real net return rate, the annual nominal net return rates are adjusted using the following formula:
\[ r_{real} = (1+r_{net})\times(1+i)-1 \]
where \(r_{real}\) is the product’s annual real net return for a given year, \(r_{net}\) is the nominal net return of the product for the same year, and \(i\) is the annual inflation rate for that same year.
Once annual nominal gross, nominal net and real net return figures are obtained, we calculate cumulated and annualised return rates on investment and on contributions over varying periods. Cumulated returns on invested assets over a period of \(n\) years are calculated based on the following formula:
\[ r_{invest_{cumulated}}^{n} = (1+r_{invest}^{y^1})\times(1+r_{invest}^{y^1})\times\ldots\times(1+r_{invest}^{y^n})-1 \]
where \(r_{invest_{cumulated}}^{n}\) represents the cumulated return on invested assets and \(r_{invest}^{y^n}\) represents the annual return on invested asset in year \(n\).
In line with our scenario of a single initial contribution to the scheme, to compute cumulated returns on contributions over a period of \(n\) years—\(r_{contribution_{cumulated}}^{n}\)—, we use the same formula, but replacing \(r_{invest}^{y^1}\) with the value of the return on contributions on the first year of the period, noted \(r_{contribution}^{y^1}\). The formula is then as follows:
\[ r_{contribution_{cumulated}}^{n} = (1+r_{contribution}^{y^1})\times(1+r_{invest}^{y^1})\times\ldots\times(1+r_{invest}^{y^n})-1 \]
The annualised return on invested assets over a holding period of \(n\) years, noted \(r_{invest_{annualised}}^{n}\), is calculated as:
\[ r_{invest_{annualised}}^{n} = \sqrt[n]{(1+r_{invest}^{y^1})\times(1+r_{invest}^{y^1})\times\ldots\times(1+r_{invest}^{y^n})}-1 \]
And the annualised return on contributions over a holding period of \(n\) years, noted \(r_{contribution_{annualised}}^{n}\), is calculated as:
\[ r_{invest_{annualised}}^{n} = \sqrt[n]{(1+r_{contribution}^{y^1})\times(1+r_{invest}^{y^1})\times\ldots\times(1+r_{invest}^{y^n})}-1 \]
In each country case, we then present jointly the average nominal gross (where available), nominal net and real net annualised and cumulated returns of products within the product category over holding periods from 1 year up to 23 years, depending on the earliest year for which data is available.
Benchmarking
The nominal gross, nominal net and real net returns calculated following the methodological steps presented above are compared to a capital markets benchmark. To conduct this benchmarking exercise, we calculate the returns of a hypothetical capital markets portfolio based on diversified equity and bond market indices.
By default, we compare performance with a 50% equity–50% bond portfolio, rebalanced annually, based on the STOXX All Europe Total Market index for equity,8 and Bloomberg Pan-European Aggregate Index for bonds.9 The two indices have been chosen due to their scope matching in most cases the investment universe of the analysed products: they are limited to European equity and to fixed-income, investment grade securities in European currencies. The 50% equity-50% bond balance is neither aggressive nor conservative and matches the asset allocation of many product categories in our study. The cumulated and annualised returns of the default benchmark (nominal and corrected by the average EU inflation rate) are presented in Figure 2.3 in Chapter 2 of this report.
Where the composition of this benchmark portfolio may not be appropriate to assess the performance of a specific product—e.g., because of regulatory constraints that may limit certain investment decisions—this composition has been adapted by modifying the balance between equity and bonds in the portfolio. In most cases, the contributors to the report have found the default benchmark appropriate to assess the performance of long-term and pension saving products. The returns of the benchmark capital market portfolio—default or modified—are in each case adjusted for inflation in the country of the analysed product category before being compared with the real net returns of the product.
Acronyms
- AIFMD
- Directive on Alternative Investment Fund Managers
- AuM
- assets under management
- CMU
- Capital Markets Union
- EC
- European Commission
- ECB
- European Central Bank
- EIOPA
- European Insurance and Occupational Pensions Authority
- ESA
- European supervisory agency
- ESMA
- European Securities and Markets Authority
- EU
- European Union
- HICP
- harmonised index of consumer prices
- IBIP
- insurance-based investment product
- IBPP
- insurance-based pension saving product
- IORP
- institution for occupational retirement provision
- IORP II
- Directive on Institutions for Occupational Retirement Provisions
- NCA
- national competent authority
- OECD
- Organisation for Economic Co-operation and Development
- OLP
- ordinary legislative procedure
- PAYG
- pay-as-you-go
- PEPP
- Pan-European Personal Pension
- PRIIP
- packaged retail or insurance-based investment product
- PTS
- pension tracking system
- RIS
- Retail Investment Strategy
- RiY
- reduction-in-yield
- SIU
- Savings and Investments Union
- TER
- total expense ratio
For IBIPs, 50% “tend to agree”, 13% “strongly agree” ; for private personal pensions 52% “tend to agree”, 18% “strongly agree”. On what this agreement is based in unclear, considering how little information on costs and performance holders of these products receive (but more on that later).↩︎
The “Supplementary pension package” includes a legislative proposal to amend the Directive on Institutions for Occupational Retirement Provisions (IORP II) (European Commission 2025d), a legislative proposal to amend the PEPP Regulation (European Commission 2025c) as well as a recommendation to the Member States on pension tracking systems (PTSs), pension dashboards and auto-enrolment (European Commission 2025b).↩︎
Trialogue negotiations are a part of the EU’s ordinary legislative procedure (OLP)—the normal legislative process for EU legislation on issues pertaining to the Single Market—where representatives of the European Commission, European Parliament and Council meet to try to align their respective versions of a legislative text and arrive at a common position.↩︎
Let’s note that the co-legislator could introduce in the RIS a mandate for EIOPA to conduct this research; that window of opportunity is still open.↩︎
The euro foreign exchange rates are available on the ECB’s website.↩︎
The reference HICP values used throughout the report are available at: https://ec.europa.eu/eurostat/databrowser/view/PRC_HICP_MIDX__custom_4 523 281/default/table?lang=en↩︎
A description and recent values of the STOXX All Europe Total Market index are available at: https://www.stoxx.com/data-index-details?symbol=TE1GR. The index values are taken gross, that is, before withholding tax.↩︎
A description and recent values of the Bloomberg Pan-European Aggregate Total Return Index are available at: https://www.bloomberg.com/quote/LP06TREU:IND.↩︎