“Will you afford to retire?” Here comes a question most people do not think about before it might be too late to do something about it (European Financial Planning Association 2025). Although personal finances might be a near constant source of worry for many of our fellow citizens, retirement planning often takes the back seat, with so many more immediate financial needs to be satisfied: “Will I afford to buy a house?”, “Will I afford to pay the school tuition fee for the children?”, “Will I afford to pay the bills this month?”, etc. That retirement planning seems a rather remote concern is understandable, but, as the analysis presented in this chapter will show, there is a lot to be done now to make sure that we will be able to live comfortably in our old age.
It should be noted that this chapter, because it aggregates data about a great number of long-term and pension savings schemes—each of them characterised by specific features—might not do justice to the beautiful diversity of the Union’s pensions landscape. Nevertheless, we sincerely believe that there is nothing like a good benchmarking exercise to ascertain whether a category of long-term investment or pension savings products truly delivers value for money. Our benchmarking exercise is composed of two aspects:
A comparison of the costs-and-performance profile of each of the analysed product categories to their peers; and
A comparison to two external performance yardsticks: first, whether that performance beats inflation, i.e., whether the real net return of the average product is positive and, second, whether the average products’ performance beats that of European capital markets.
2.1 Transparency: The quest for data
“Unity in diversity” might be the moto of the European Union (EU), when it comes to collecting and comparing data about pension systems and schemes across the its Member States, this diversity is a considerable challenge, but one that our dedicated team of expert contributors have been taking up for more than a decade now, progressively collecting a considerable data set. This chapter of the report builds on this data set to present an EU-level overview and comparative perspective of the performance of supplementary pensions.
Comparisons are rendered particularly complex by the lack of a fully harmonised set of concepts and reporting frameworks across countries and products. Broad categories such as “occupational” vs. “voluntary”, “pension fund” vs. “life insurance”, or “asset management costs” vs. “administrative costs” are interpreted in different ways. Nevertheless, our expert contributors have, to the greatest extent possible, ensured that the categorisations and calculations hereafter presented are accurate and faithfully account for the performance of long-term and pension saving instruments in the countries we analyse.
Obtaining reliable data about the cost and performance of the entire market for any given product category too often remains a challenge. Each year, we manage to scrap some more data about this or that product category, but obtaining consistent time series of performance figures or costs data, with the specifications necessary to assess whether and howwe can use them in our calculations and comparisons remains, in some countries and for some product categories, a herculean task.
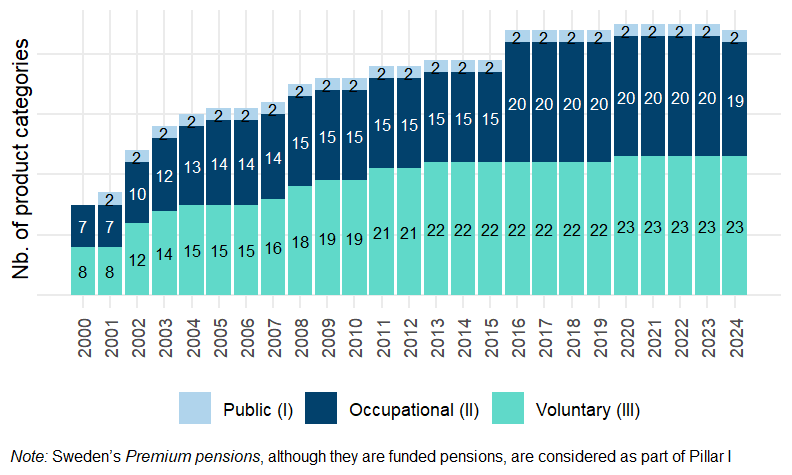
As Figure 2.1 shows, we strive to collect data about performance for the longest period possible, starting, whenever possible in the year 2000. Only for a few product categories do we have such long—a quarter of a century—time series. For the others, the short reporting period is often due to the fact that the product category was created later than 2000—the latest entrants in our data set being the two offers of Pan-European Personal Pension (PEPP) in Slovakia since 2022 and Poland since 2024—but in some cases this shorter perspective is due to the absence of (reliable) data for the early years of the 21st century.
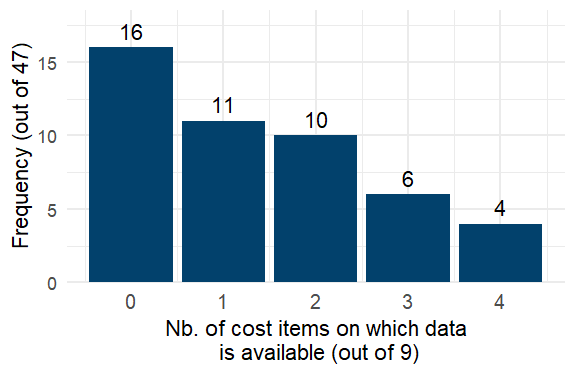
Data about cost is particularly hard to come by, especially when we try to obtain a breakdown of these costs by cost item. As Figure 2.2 shows, for 16 of the 47 product categories we analyse (34% of our sample), we cannot get any reliable data about the average costs of products. For these product categories, performance data is disclosed net of costs and charges by national competent authorities (NCAs) or trade associations; we are then still able to compute the real net return over varying holding periods, but we cannot ascertain the importance of fees as a performance (or, rather, underperformance) driver.
For the remaining 29 product categories, the data we can obtain usually aggregates cost items into one or, at best, a handful of cost metrics. Where these aggregate cost metrics are carefully constructed to account for the total cost of the product and information about the construction of the metric is communicated, we can be certain that our calculations of nominal gross and net returns effectively reflect the costs borne by individual scheme participants. In that regard, initiatives such as the Dutch pension funds’ harmonised cost reporting, which was agreed between the industry’s representative body and the Dutch central bank in 2015, make our lives easy: cost item definitions are uniformly defined and applied by all providers and clearly communicated by the Dutch central bank, who also centralise the reported cost and performance data and make fund-level data available on its website. Another helpful approach is that of the Italian .na.character (COVIP), which supervises pension funds and personal pension schemes and computes annually a “synthetic cost indicator” — Indicatore Sintetico dei Costi (ISC) covering the total cost of investing in these schemes for varying holding periods up to 25 years. COVIP reports the average but also maximum and minimum ISC for each holding period, which then provide a good view of the overall market; if such a metric were to be communicated to scheme participants—the ISC of their own plan together with the average, minimum and maximum ISC of products in the same category, it would greatly ease the comparison of costs across products on offer. On the negative side, however, such a synthetic indicator hides which cost item or items might be driving high costs: an itemised breakdown should still be reported (making a clever use of information layering, when reporting to scheme participants).
Too often, however, cost data is either poorly specified or incomplete, affecting the reliability of our gross vs. net return calculations. Incomplete cost data—i.e., cost data that only cover some but not all cost items—mean that our computations underestimate the effect of costs on performance, something readers should keep in mind when reading (most of) the country cases in the remainder of this report. Poorly specified data—i.e., data that is provided without a clear explanation of what cost items are being measured—create a margin of error, since we sometimes need to guess (like scheme participants need to guess) what, e.g., “administrative cost” effectively refers to.
Finally, our contributors collect data about the allocation of pension assets into a series of large asset classes. There again, it often is a challenge to obtain reliable data about what providers of a specific category of products invest in, data that would enable us to readily measure the average risk-return profile of the product category. Besides NCA or trade association reports at the national level, asset allocation data is published by the European Central Bank (ECB) for pension funds and the Organisation for Economic Co-operation and Development (OECD), but with definitions that do not fully match, and definitely do not match the definition of institutions for occupational retirement provision (IORPs), for which European Insurance and Occupational Pensions Authority (EIOPA) maintains a detailed asset allocation data set, as well as a data set about the asset allocation of life insurance companies. Besides having different perimeters, these EU or international level data sets refer to types of providers as their basis unit, not to types of products. This may seem trivial, but there is a not-insignificant number of cases in this report of products that may be offered by more than one type of provider and of particular types of providers managing different categories of products.
2.2 Operating context
We already mentioned the two performance “yardsticks” which we consider in this report’s analysis of the performance of long-term and pension savings products: capital market performance and inflation. Together they form the basic macroeconomic and financial context in which product managers operate, the raw “facts” that enable or constrain their performance. In this section we review the latest development of that context.
Equally important for pension savers if the tax regime applicable to their savings in each of the categories of products we analyse. Although we do not compute after-tax returns in this report—specific tax rates often depend on the income bracket of individuals, making computations near impossible—we review the European landscape in terms of the fiscal regimes applied to long-term and pension savings vehicles.
Capital market performance
As already mentionned in the previous chapter, European capital markets has a rather good 2024. In spite of the geopolitical instability, European listed equity markets (as measured by the STOXX All Europe Total Market index), grew 8.76% last year, while the bonds market (as measured by Bloomberg’s Pan-European Aggregate index) has a modest but definite 2.46% increase. Both fall short of their 2023 performance—+16.12% for equity, +7.48% for bonds—but is a second year in a row of substantial capital gains.
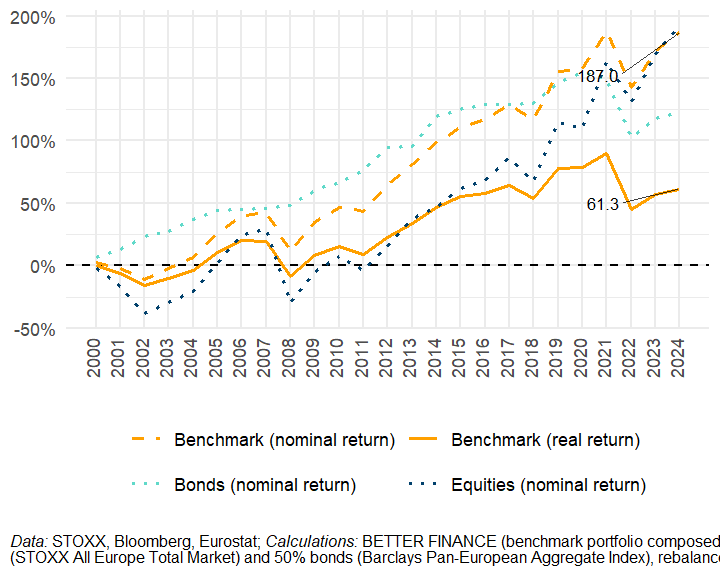
Though European markets may be less dynamic than those of other world regions—the United States (US) in particular—their track record displayed in Figure 2.3 shows that there is performance in the assets underlying pension savers’ investments in long-term and pension savings vehicles.
Inflation
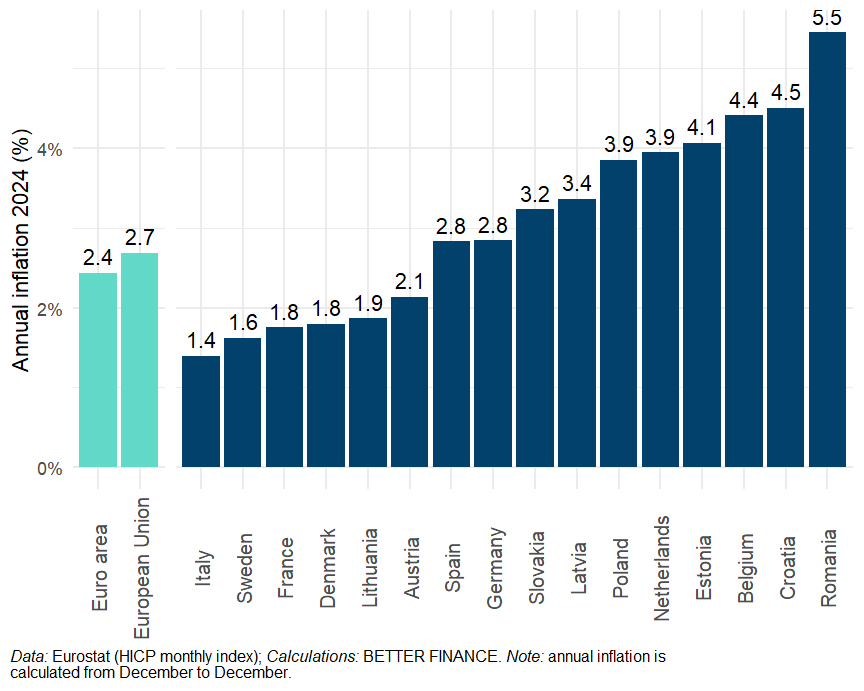
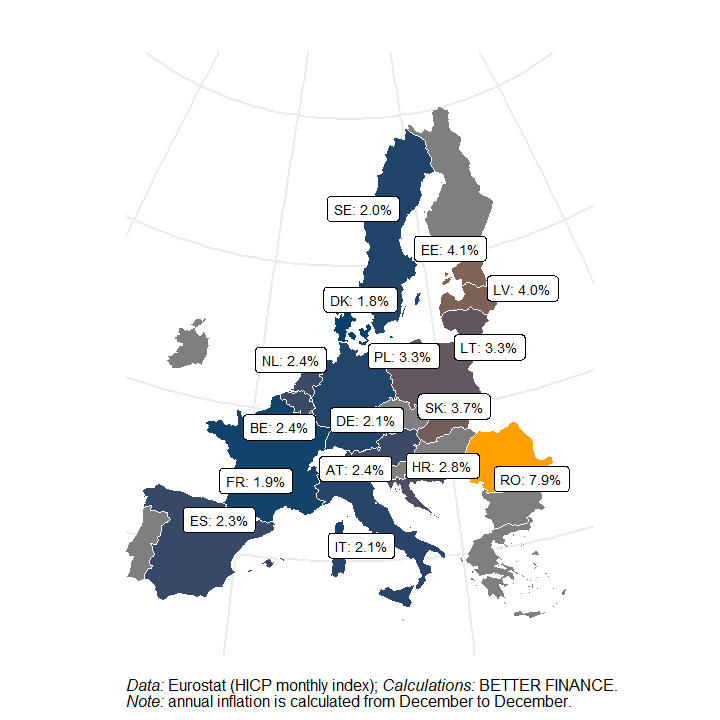
As already shown in the previous chapter with Figure 1.4, inflation has, on average across the EU, receded to close to where it used to be until the early 2010s. That is good news, especially for those amongst usliving—and saving—in countries where inflation peaked at lower levels and/or fell back to lower levels, e.g. Italy, Sweden and France (see Figure 2.4).
Looking back to the first quarter of this 21st century in Figure 2.5, we observe structurally higher inflation in the Eastern Member States, with Romania standing out with a 7.9% average annual inflation. This higher inflation, of course, means that nominal gross financial performance of Central and Eastern Europe (CEE)’s pension savings need to be substantially higher for participants in those plans to obtain a positive real net return.
Taxation
Taxation is the third of the main factors impacting the net return one can expect from their long-term and pension savings that is out of product manufacturers’ reach: In the EU like in most of the world, tax rules on these savings are decided by national parliaments and governments. Taxes on pension savings may be applied at three different stages: on contributions, on investment returns, and on payouts. Tax regimes may vary across product categories within a same country. The multiple shades of taxation regimes are schematically summarised in the country cases under tax regime “types” defined by whether taxes are applied at each of the three stages.
In its conceptual framework on pensions, the World Bank highlights the important role that tax incentives can play in fostering private pension savings World Bank (2008). In line with the Bank’s recommendations, a large majority of the long-term and pension saving products analysed in this report (39 out of 48) are subject to a “deferred taxation” model, whereby contributions are exempt from tax while pension payouts are taxed to various extents and in various ways. While lump-sum withdrawals at retirement age may be tax exempt, the amounts that can be withdrawn are also often limited; annuities, by contrast, are often subject to personal income tax.
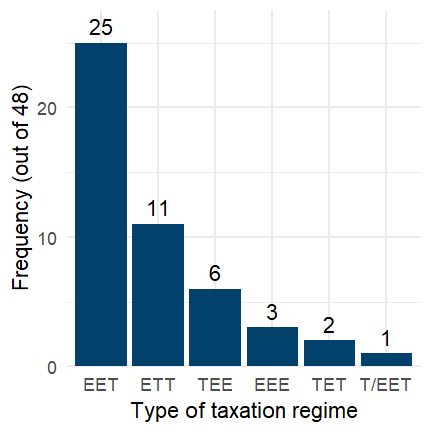
The Exempt Exempt Taxed (EET) regime is the most common in our study (25 out of 44 product categories, see Figure 2.6). The EET regime is “a form of taxation of pension plans, whereby contributions are exempt, investment income and capital gains of the pension fund are also exempt, and benefits are taxed from personal income taxation” (World Bank 1994).
The second most common regime, the Exempt Taxed Taxed (ETT) regime, differs from the former only in that investment returns are subject to tax. Three countries fully exempt—Exempt Exempt Exempt (EEE) regime—mandatory occupational pension savings (Pillar II) from tax: Lithuania, Romania and Slovakia.
Deferred taxation regimes work well with regard to incentivising savings. Many of the most popular pension saving products across Europe owe their popularity to the fact that people can deduct from their taxable income the amounts paid into their pension savings. And since retirement income is lower than working life income, the applicable income tax rate is often lower. The tax advantage is often the first argument put forward by distributors of these products to convince consumers, while they usually remain silent on the costs and performance.
However, deferred taxation applies to nominal pension payout amounts, which may work at the disadvantage of savers: between the time of contribution and the time of payout, inflation has significantly reduced the actual purchasing power of those contributions (cumulated inflation reached 77.9%, on average in the EU between 2000 and 2024). Taxing the nominal value of pension payouts therefore implies an effective tax rate that is potentially much higher than the nominal tax rate.
Taking the reverse approach—taxing contributions—is much less common: Only 7 product categories are subject to either a Taxed Exempt Exempt (TEE) regime (French life insurance and Polish pension funds and PPKs), or a Taxed Taxed Exempt (TTE) one (Denmark’s Aldersopsparing). Savings in French corporate Defined contributions (DC) plans are subject to a either a Taxed Exempt Taxed (TET) or an EET regime, depending on whether contributions are made by the employer or not.
2.3 Performance review: Looking back at 2024 and beyond
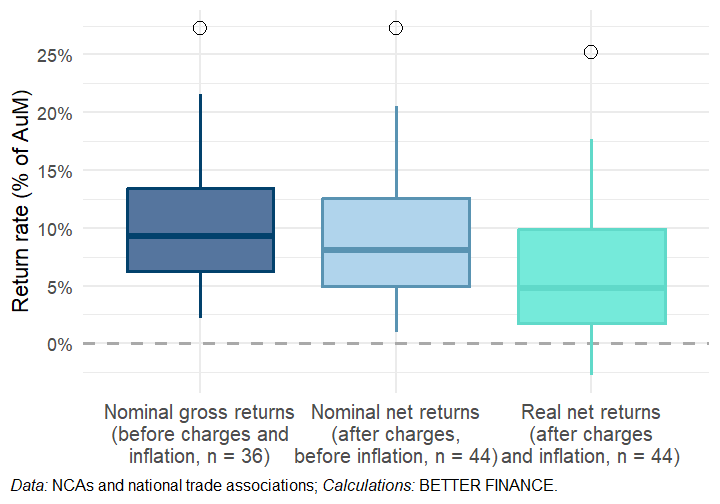
From the rather good performance of European capital markets and the receding inflation, pension savers could expect to have had a good year in 2024, which our data confirms (see Figure 2.7).1 The median return before charges and inflation (nominal gross return) across the 36 categories of products we analyse reached 9.3% last year. Across the 44 categories for which we can compute returns net of charges in 2024, the median return was still 8.1%. Inflation, through receding, still significantly affected returns: the median real net return was only 4.8%.
Of course, the median hides great disparities. Participants in Sweden’s AP7 Såfa are likely to rejoice at the 27.3% increase in the value of the plan’s assets, in nominal terms and before charges, which, even after cost and inflation leaves them with a solid +25.2% real net return. By contrast, participants in Polish voluntary pension funds will have had a certain disappointment at the mere 2.2% nominal gross return of their pension savings, which costs and inflation turned into a 2.7 loss of purchasing power.
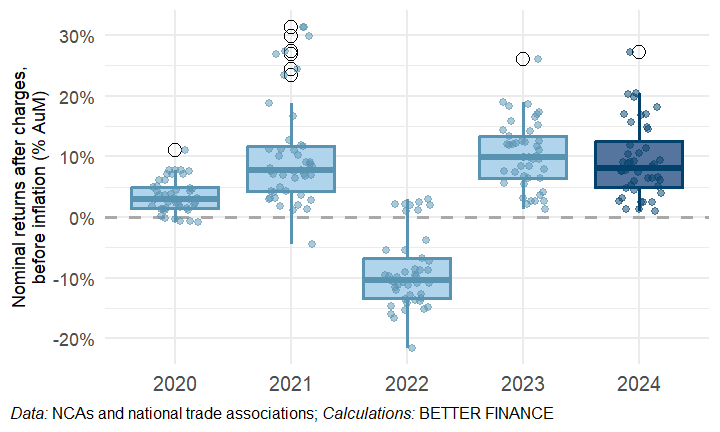
We can see in Figure 2.8 the nominal returns of European supplementary pensions in 2024 rather favourably compare to their performance in recent years, especially to the calamitous performance of 2022, when the median nominal net return plunged into negative territory at -10.4% with a minimum performance as low as -21.5%. But it does not reach the heights reached in 2021 (median and maximum nominal net return of +7.8% and +31.4%, respectively) and 2023 (median nominal net return of +9.8%).
There ends the good news. “One swallow does not a summer make”, one good year—or even a few good years—do not make good long-term returns, as we can readily appreciate in Figure 2.9, which shows in the blue boxes the distribution of the annualised real net returns of the products in our data set over increasing holding periods, as well as the performance of our capital market benchmark over the same period. Here we obviously see the depressing effect of the 2022 “perfect storm”—when both equity and bond markets took a plunge while inflation spiked—dragging the short- to medium-term performance of most of the analysed products into negative territory.
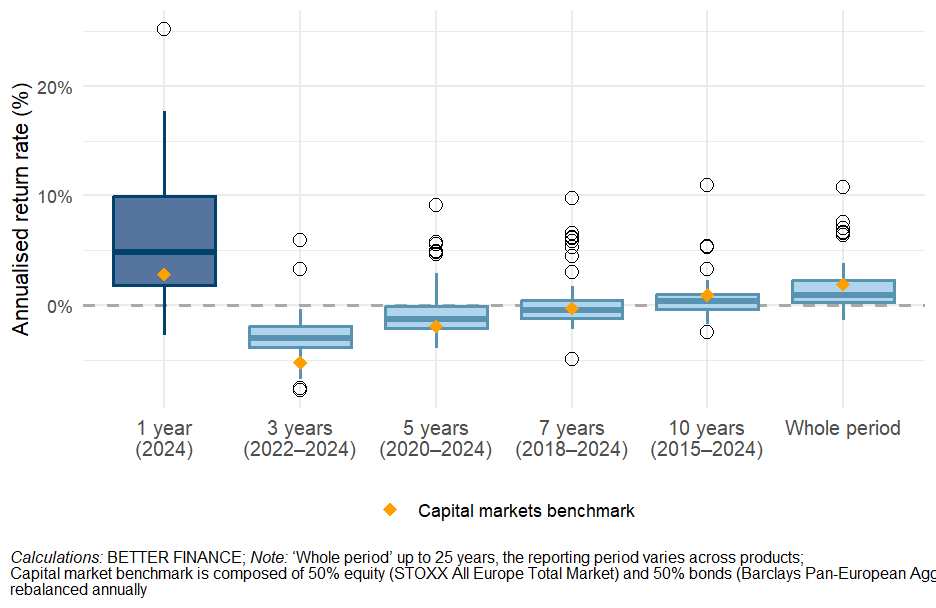
More preoccupying, though, are the low returns observed over 10 years and “whole periods”, that is, for each product category, the whole period for which we have performance data, up to 25 years: not only do most products fail to beat the benchmark—the yellow diamond is on the upper bound of the interquartile range for the 10 years period—but a good number even fail to offer a positive real net return. Table 2.1 details the figures for the whole set of analysed product categories.
| Holding period | Nb. of product cat. | Median | Mean | Standard Deviation | Best performance | Worst performance |
|---|---|---|---|---|---|---|
| 1 year | 47 | 4.5% | 5.4% | 6.9pp. | 25.2% | -11.8% |
| 3 years | 45 | -3.2% | -3.1% | 2.5pp. | 5.9% | -7.7% |
| 5 years | 45 | -1.3% | -0.4% | 2.9pp. | 9.1% | -4.2% |
| 7 years | 44 | -0.5% | 0.3% | 3.0pp. | 9.7% | -4.9% |
| 10 years | 39 | 0.3% | 0.7% | 2.3pp. | 11.0% | -2.4% |
| Whole period1 | 47 | 0.9% | 1.8% | 2.9pp. | 11.4% | -1.4% |
| 1 Whole period varies across products (up to 25 years). | ||||||
| Calculations: BETTER FINANCE | ||||||
Managers of long-term and pension savings schemes that do offer good returns, beating inflation and capital markets, might feel more than a little aggrieved by our comments on the generally disappointing yield of the sector. Understandably: as much as our results disprove the idea that “value-for-money issues” are limited to a handful of black sheep, there thankfully are providers whose long-term investment and pension savings scheme do offer good—even great—performance.
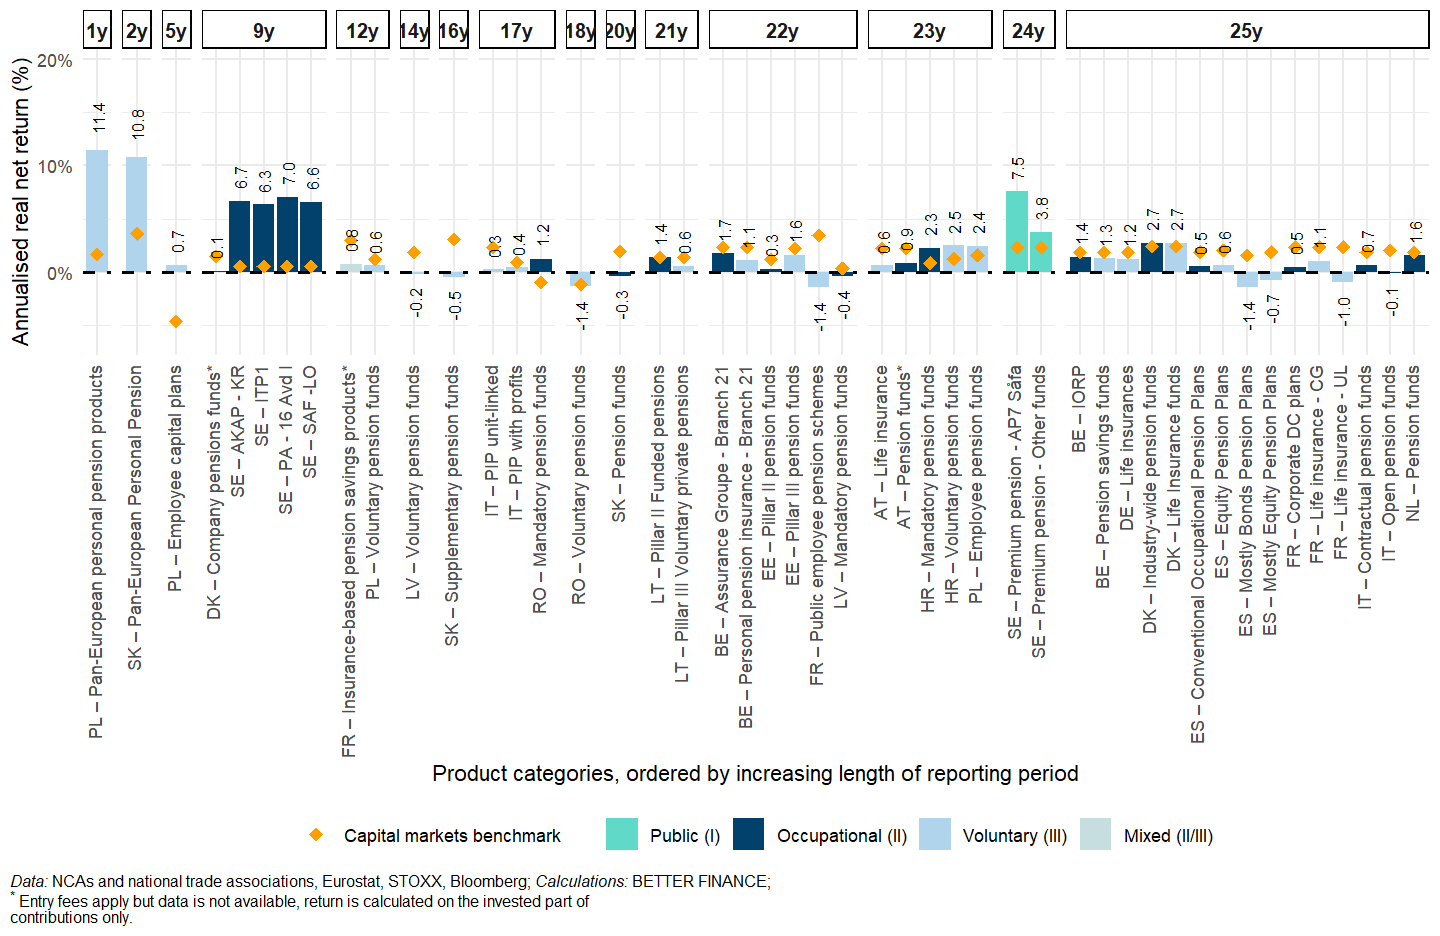
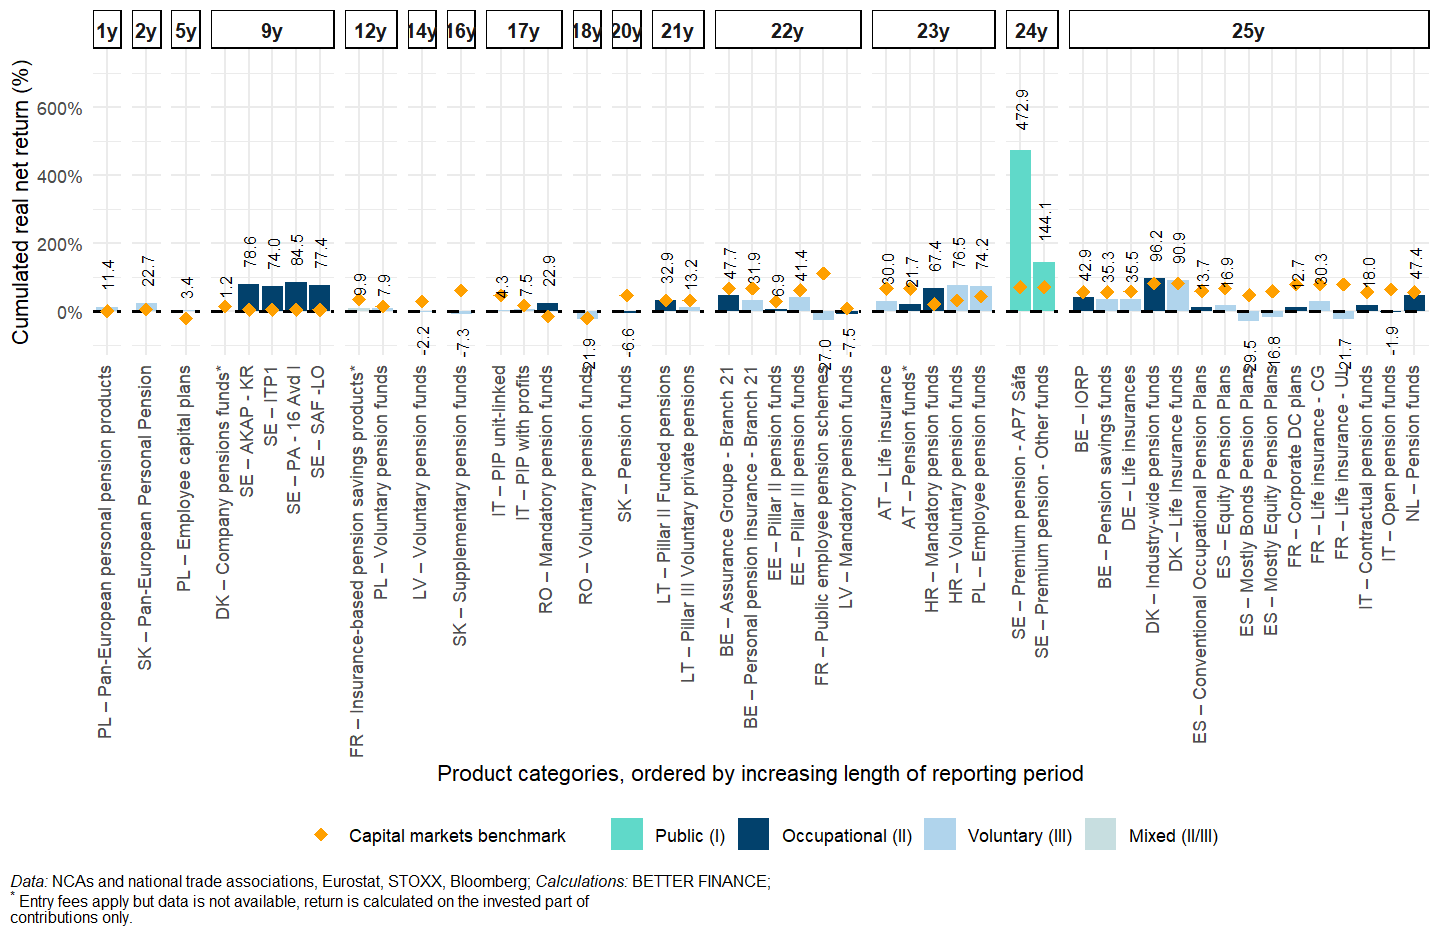
Figure 2.10 and Figure 2.11 show, with an annual average real net return of 7.5% over the past 25 years, the return of Sweden’s AP7 Såfa, the default scheme for the country’s Pillar I-bis Premium pensions (more details in Chapter 18) clearly stands out of the crowd of those product categories for which we have 10 years of data or more. In cumulated terms, this amounts to a +472.9% return, i.e., a purchasing power of savings multiplied by more than 5. With 3.8% per year over 24 years for the other premium pensions and above 6% annualised return over the past 9 years, the other public and occupational Swedish pensions also show strong performance, compared to the rest of our sample of product categories: “We all want to live in Sweden now”, as one well-informed official from the European Commission said at a recent BETTER FINANCE event on supplementary pensions.2
The contrast is stark with those products that display a negative cumulated real net return, like French unit-linked life insurance (-21.7% over 25 years) or French public employee pension schemes (-27% over 22 years)—Liberté, égalité, fraternité but in poverty—or Spanish “mostly bonds” individual pension plans (-29.5% over 25 years).
Costs
Costs of long-term and pension savings products analysed in this report remained stable, overall, in 2024, with the median ongoing and entry fees remaining at 0.5% and 0.6% respectively, while the average ongoing fees remained at 0.8%, with a maximum value of 3.4% (down from 4% in 2023) and a standard deviation falling to 0.78 percentage point (p.p.), which indicates a narrowing of the price range towards somewhat lower values. As regards the 8 categories of products for which we could obtain entry fee data, however, the average entry fee still amounts to 2.3% of contributions or premia, driven by a maximum entry fee of 12.1%.3
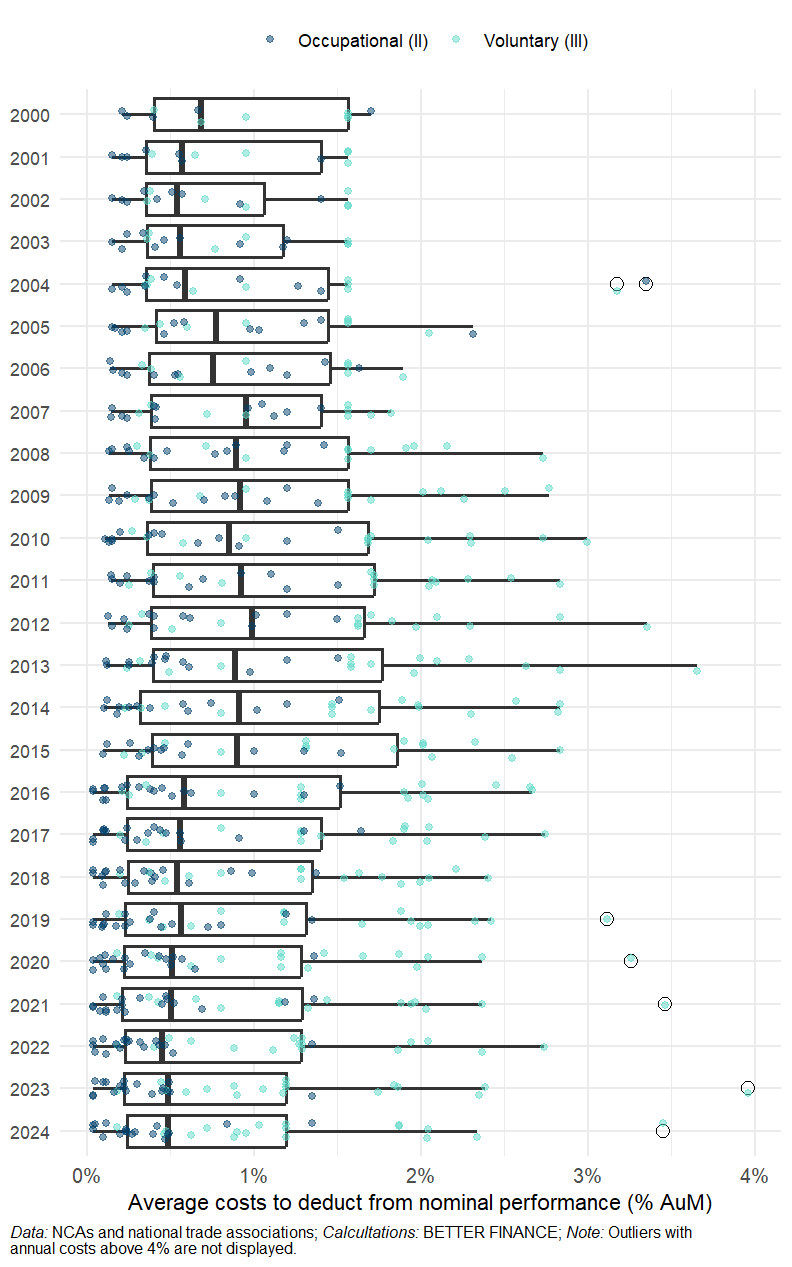
As we can appreciate in Figure 2.12, ongoing costs of long-term and pension savings products, which rose progressively from 2002 to 2012—when the median value of average ongoing costs reach its peak at 1%—subsequently decreased until 2022, when the median value fell to its minimum value over our period of observation with 0.4%.
Beyond the median value of average ongoing costs, however, we should remark the compression that seems to have occurred in the higher end of the distribution (shown by the reduced size of the right-hand part of the boxes and the right-hand whiskers in Figure 2.12). It looks like, with the exception of a few outliers, most of the most egregiously expensive schemes have either lowered their fees or been driven out of the market. From the point of view of participants, this is a most welcome evolution, which we hope will continue with the development of supervisory work on Value-for-Money supervision European Insurance and Occupational Pensions Authority (2022), the adoption of the Retail Investment Strategy (RIS) by the EU co-legislator, and, hopefully, more transparency on costs and charges to put pressure on managers to increase the cost-efficiency of their pension schemes.
Returns compared to banks and capital markets
These disappointing results may lead one to believe that investing one’s savings is a recipe for disaster. Nevertheless, if we compare the return of these long-term and pension savings product categories to the interest rates served on bank savings accounts across the 16 countries that our report covers, it is immediately obvious that one should not let their savings sleep on a bank account. As Figure 2.13 shows, based on the collected data on the performance of pension savings products and on ECB data about the interest rates on households’ deposits with banks, over the past ten years, even the most underperforming of the product categories in our report beat the highest-performing of bank savings accounts.
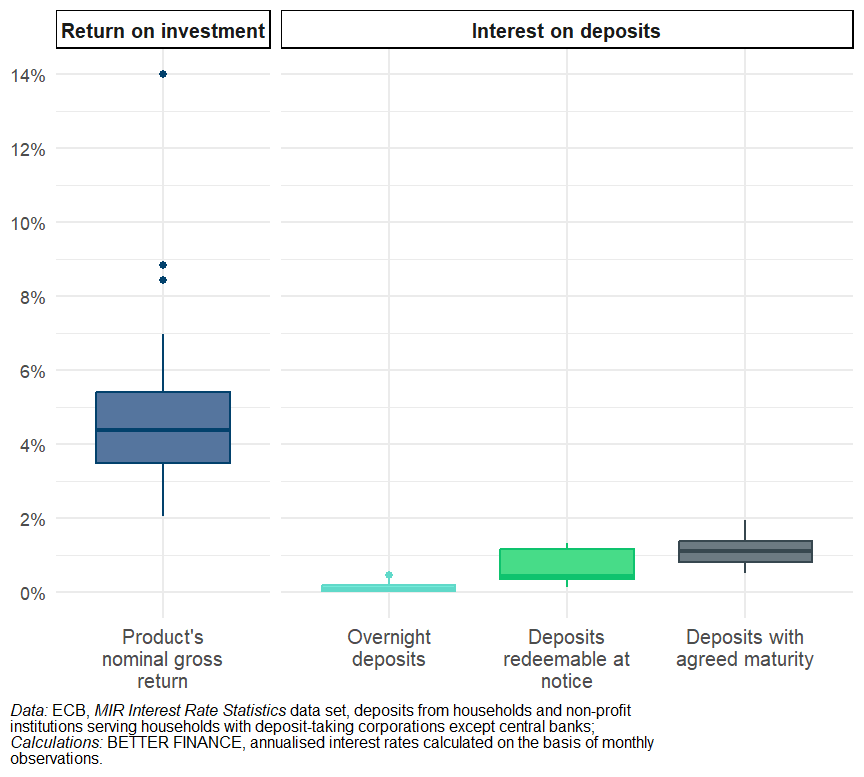
Note that here we compare the interest rates on deposits to the gross return on assets invested in pension funds, life insurances and other pension savings products: since the interest rate data from the ECB does not consider the fees that bank charge their clients for their services, it would be inappropriate to compare these to the net return—i.e., after costs and charges—return of the products we analyse. Nevertheless, with such low interest rates on bank deposits, even with small fees and relatively small inflation, it is certain that savings that are kept as deposits with banks will return a loss in terms of purchasing power.
However, comparing the cumulated returns of the analysed products to the returns the the hypothetical portfolio of European equity and bonds that we use as our capital market benchmark, we measure the extend of the pervasive underperformance: out of the 47 analysed product categories, only 15 have managed to offer returns superior to those of our capital market benchmark.
| Nb. of product categories | Median distance to benchmark (p.p.) | Median performance (% of AuM) | Max. performance (% of AuM) | Min. performance (% of AuM) | |
|---|---|---|---|---|---|
| Above benchmark | 15 | 43.5 | 76.5% | 472.9% | 3.4% |
| Below benchmark | 32 | -33.8 | 11.3% | 47.7% | -29.5% |
| Calculations: BETTER FINANCE; Note: returns of products and of benchmark are calculated over the whole period for which data about the performence of the product is available (up to 25 years) | |||||
It could be said that our benchmark portfolio, being based as it is merely on the calculation of the performance of capital market indices, has the somewhat unfair and quite unrealistic advantage of not entailing any cost for our hypothetical investor, something that no real-life investment product could offer. True enough. But let us consider the cheapest way for an investor to invest in our benchmark portfolio. They would do that through a hypothetical equity exchange-traded fund (ETF) tracking the STOXX All Europe Total Market index and a equally hypothetical bond ETF tracking the Bloomberg Pan-European Aggregate index, which we shall assume to have a total expense ratio (TER) equal to the average TER of European ETFs in their categories—0.352% for equity and 0.221% for bonds in 2024 (Glow 2025), setting the overall ongoing costs of our portfolio at 0.287% for that year. We shall also assume that they would have looked for the investment platform offering the lowest transaction costs to buy their ETFs and would have found offers at a 1% cost for a single transaction (in line with the scenario we adopt in this report) or even free of charge if they had set up an “ETF savings plan” to make regular investments. Considering the level of costs of the products we analyse (see Section 2.3.1), it can safely be assumed that the performance of most of the 32 product that fail to beat our “unrealistic” benchmark—by a median margin of 33.8 p.p.s, cumulated over their respective entire reporting periods—would still fail to beat it.
It is not a little ironic, as representatives of the Financial Independence Retire Early (FIRE) movement might argue, that the best way to obtain a high return on one’s pension savings might be, for many Europeans, to stay away from “pension” products.
A structural performance gap between pillars?
A quick look at the data shows that there seems to be a structural performance gap between occupational (Pillar II) and personal, voluntary private pensions (Pillar III). Looking at Figure 2.14, we see that performance is, overall, better in Pillar II than in Pillar III: in nominal terms, the median 10-year performance of Pillar II schemes (3.55%, thick line in the middle of the box) is higher than the upper quartile of the distribution of performance of Pillar III schemes (3.3%, upper bound of the box), and the median value performance in Pillar III (2.9%) is only slightly above the lower quartile of Pillar II performance (2.8%). In other words, before adjusting for inflation, at least, 75% of Pillar II product categories perform better than the median Pillar II product.
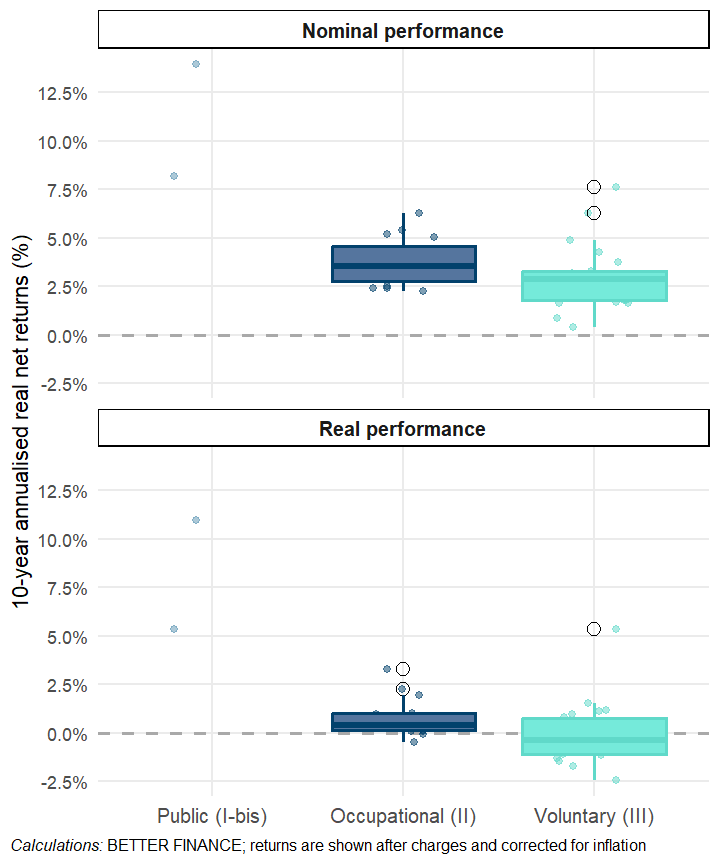
This observation is confirmed by the figures in Table 2.3, where we see that the median and average return of occupational products (Pillar II) in our data set is consistently higher than the median and average return of personal, voluntary products (Pillar III).
| Holding period | Nb. of product cat. | Median | Mean | Standard Deviation | Best performance | Worst performance |
|---|---|---|---|---|---|---|
| Public (I)1 | ||||||
| 1 year | 2 | 13.4% | 13.4% | 16.7pp. | 25.2% | 1.6% |
| 3 years | 2 | 1.0% | 1.0% | 6.9pp. | 5.9% | -3.9% |
| 5 years | 2 | 6.0% | 6.0% | 4.4pp. | 9.1% | 2.9% |
| 7 years | 2 | 7.1% | 7.1% | 3.7pp. | 9.7% | 4.5% |
| 10 years | 2 | 8.1% | 8.1% | 4.0pp. | 11.0% | 5.3% |
| Whole period2 | 2 | 5.7% | 5.7% | 2.7pp. | 7.5% | 3.8% |
| Occupational (II) | ||||||
| 1 year | 20 | 5.3% | 6.4% | 4.1pp. | 14.9% | -0.5% |
| 3 years | 20 | -2.9% | -3.0% | 1.9pp. | -0.4% | -7.7% |
| 5 years | 20 | -0.9% | 0.1% | 2.7pp. | 5.6% | -3.4% |
| 7 years | 20 | 0.0% | 1.1% | 2.8pp. | 6.5% | -1.2% |
| 10 years | 15 | 0.3% | 0.8% | 1.0pp. | 3.3% | -0.5% |
| Whole period2 | 20 | 1.3% | 2.1% | 2.5pp. | 7.0% | -0.4% |
| Voluntary (III) | ||||||
| 1 year | 25 | 2.5% | 4.0% | 7.7pp. | 17.1% | -11.8% |
| 3 years | 23 | -3.4% | -3.5% | 2.3pp. | 3.3% | -7.5% |
| 5 years | 23 | -2.1% | -1.5% | 2.1pp. | 5.7% | -4.2% |
| 7 years | 22 | -1.4% | -1.0% | 1.9pp. | 5.3% | -4.9% |
| 10 years | 22 | -0.3% | 0.0% | 1.6pp. | 5.3% | -2.4% |
| Whole period2 | 25 | 0.6% | 1.4% | 3.1pp. | 11.4% | -1.4% |
| 1 Swedish Premium Pensions are public pensions (Pillar I bis) | ||||||
| 2 Whole period varies across products (up to 25 years). | ||||||
| Calculations: BETTER FINANCE | ||||||
We plan to further analyse the effect of a potentially different asset allocation profile across pillars to identify whether this may, at least partly, explain the cross-pillar performance gap. In the meantime, looking at Figure 2.15, we can certainly confirm that there is a structural cost differential between Pillar II and Pillar III which is sure to play a role in the observed relative underperformance of personal pensions. The figure shows, for each pillar, the median value across the average ongoing costs of product categories in that pillar: The median value of Pillar III average ongoing costs has been 1.5% over the period 2000-2025, and even though there is a clear decline in Pillar III costs since 2016, these remain above 1% when the median value of the average costs of occupational pensions (0.4% on average since 2000) has fallen to around 0.25% since 2019.
Overall, since 2000, the cost differential between Pillar II and Pillar III products amounted to 1.1 p.p. on average. Considering the cumulative effect of ongoing costs, the result on long-term performance is more than substantial: the cumulated ongoing cost of the median Pillar II product over the past 25 years amount to 9.9% of assets, but the cumulated ongoing cost of the median Pillar III product eats 43.3% of assets. When thinking about which is the best way to design the pension systems of tomorrow, this is the kind of findings policy-makers should bear in mind.
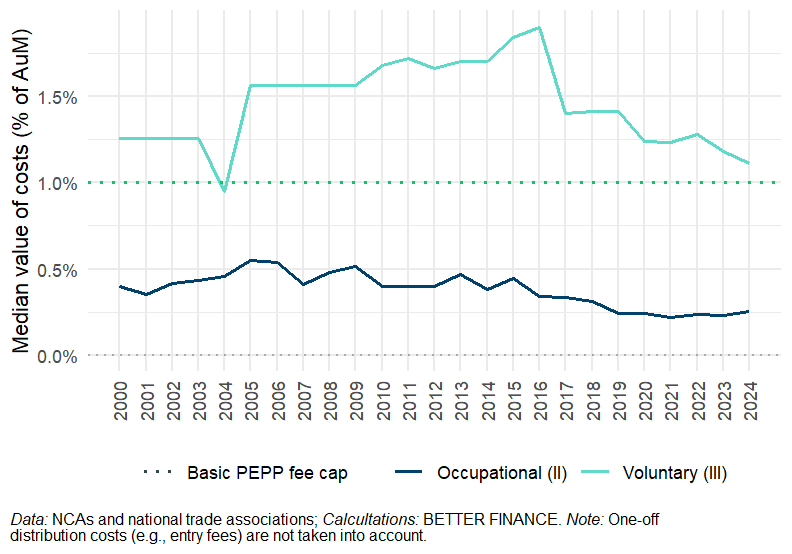
We also note that 1% of assets per annuum (p.a.) is the cap on total fees applied to the “Basic” PEPP—that is, until the co-legislators decide whether or not to heed the European Commission’s call to replace that cap with a “Value for Money approach” the contours of which are still highly uncertain. Looking at Figure 2.15, we might be tempted to say that the personal pension product market is slowly but surely moving towards the cost-efficiency embodied by the Basic PEPP. That would be terrific news, but there are two caveats to that conclusion:
first, as we noted in Section 2.1, the cost data that we are able to collect is often inconsistent and incomplete, which is more than likely to entail an underestimation of the costs of many product categories;
second, the figures shown here only reflect the median value of average ongoing costs levied on assets, but many products, especially personal products, entail fees on contributions or premia (entry fees, acquisition fees), which can indeed be quite hefty.
By contrast, the 1% fee cap on the Basic PEPP is “all inclusive”, covering distribution as well as product costs.
2.4 Policy recommendations
The purpose of this report is not to lament our fate, but rather to suggest potential courses of action. Such is the focus of this last section of the first part of our report.
With its “Supplementary pensions package”,4 the European Commission tabled a number of highly relevant proposals that appear to translate into the EU legislative framework a number of the initiatives that BETTER FINANCE has been calling for. Although we are still, at the time of writing, analysing the precise content of those proposals (“the devil is in the details”, as the saying goes), we warmly welcome the European Commission’s decisive orientation in favour of a better outcome for long-term individual investors and pension savers and the wording of its proposals, which stresses that:
The envisaged measures aim mainly to increase the financial security of people after retirement, while contributing to the long-term sustainability and resilience of pension systems, in light of pressing demographic challenges as well as the persistent gender pension and coverage gaps.
Nevertheless, BETTER FINANCE calls for caution with the second objective of the proposed package, which, as stated by the Commission, is “to bolster capital market development and investment in EU growth and innovation, an objective that is also being addressed through several other actions under the SIU” (European Commission 2025d, 7). While we support Savings and Investments Union (SIU) initiatives to develop and integrate European capital markets into a genuine single market for savings and investment products, we warn against forcing retail investments into insufficiently diversified investments or markets that may lack the transparency that is necessary to properly assess and monitor the risk for investors. We maintain that investment decisions should be based, first and foremost, on the risk-return profile of the investment and not on whether that investment is considered a priority by political authorities.
More reliable, intelligible and comparable information
The lack of reliable, intelligible and comparable information on long-term and pension savings products has been a recurring theme in this report series since its first edition more than decade ago.
At the level of individual products, some progress was made, for instance with the creation of the Key Investor Information Document (KIID) for investment funds under the UCITS Directive (UCITSD), and then with the extension of the principle of a Key Information Document (KID) to all packaged retail and insurance-based investment products (PRIIPs). Unfortunately, the PRIIPs KID remain too long and complex for the average individual to understand what risk they take and what return to expect by investing in a given product. The RIS negotiations may still, hopefully, deliver some positive change with the introduction of information layering into the layout of the KID and, crucially, the possibility to display past performance data to inform prospective investors of the performance track record of a product in a simple, comparable way (with the ever-necessary warning that past performance is no guarantee of future performance). Nevertheless, we sincerely believe that a more thorough review of the PRIIPs KID is necessary to simplify its presentation and content and turn it into a truly empowering tool for individual investors. We believe that, in order to properly inform investors about the real long-term performance of pension products, the KID should include, to the extent possible, ten years of past performance figures, together with inflation and the performance of the capital market index of any other benchmark used by the fund or product manager to measure their performance.
We welcome the Commission’s recommendation to the Member States to establish PTSs, or enhance them where they already exist. As the Commission notes, “existing pension information services in most Member States remain fragmented across different pension pillars and offer incomplete coverage, in particular on entitlements from supplementary pension schemes” (European Commission 2025d, 8). If they are to serve as tools for proper retirement planning, PTSs must offer individuals a comprehensive view of their accrued pension rights and accumulated pension savings across all of the pension schemes they participate to, including Pillar III PPPs that are, at the moment, mostly missing. In terms of the information to be displayed, we argue that, at least for funded pensions (i.e., excluding pay-as-you-go (PAYG) schemes), a proper PTS should display the total amount contributed and the total amount credited to the individual’s account (i.e., contributions plus financial gains, which, preferably, should be positive), a track record of financial performance, in nominal gross, nominal net and real net terms (as we show in this report), a track record of the total costs borne by the pension saver—with access to an itemized breakdown—and their overall effect on performance since the beginning of the contract/participation to the scheme, and a summary of the main features of the product or scheme which the participant may consider relevant in their assessment of the value for money the scheme offers.
The development of these PTSs across the EU should ideally be coordinated, with national authorities and stakeholders defining a common framework for the reporting of fundamental information on retail investment products. Establishing a common dictionary of terms of reference to be used by all managers of long-term and pension savings products would ensure the comparability of data across schemes and products—which could be used to greatly improve the KID—and simplify their aggregation into PTSs, for the benefit of pension scheme participants, as well as pension dashboards to be used by policy-makers and supervisors.
We also consider that pensions dashboards should be made public, this for two main reasons. First, we belive that making public an overview of the performance of the whole market for a given category of product enables individual to compare the benchmark the schemes they contribute to to that market. Second, since most pension saving products are granted tax incentives, which have a fiscal cost, borne by the collectivity, citizens should be able to ascertain that these public expenditure are indeed put to good use, that they indeed achieve the policy objective of ensuring an adequate retirement income to the population.
Finally, product information about individual products and schemes should be aggregated into publicly accessible comparison portals, such as the “Finansportalen” maintained by Norway’s Forbrukerrådet.5 Such tools available on a national but also European basis would facilitate benchmarking exercises for product manufacturers, make advisors’ research of suitable products easier and empower investors by providing them with an easy, straightforward way to access and compare information on products.
We urge the Commission to make proposals in that sense to complement those already tabled as part of its “Supplementary pensions package”, the Member States to take up the Commission’s recommendation on PTSs and pension dashboards, and the industry to come together with representative of individual investors and supervisors to lay the groundwork for a truly harmonised and cost-efficient product data reporting framework that ensures the seamless flow of relevant information from providers to supervisors and investors.
Simple and cost-efficient supplementary pensions
The data we have presented in this report reflect a supplementary pensions landscape where too many pension schemes offer a return that is not proportionate to the costs they impose to their members. Cost-efficiency does not necessary mean “low-cost”, nevertheless with many Europeans doubting that their pension products offer good value for money, it seems unlikely that the EU will be able to turn its great savers into great investors unless it acts decisively in favour of pension products that show a better cost-performance profile.
Simplification is the name of the game: Many pension products today offer guarantees (guarantees of the capital, guarantees of a certain minimum return) which are costly to implement for pension scheme managers, who in addition, use these additional services as an argument to inflate costs and charges when, in truth, such guarantees are usually unnecessary. A life-cycle approach to asset allocation has been shown to be more effective than capital guarantees to provide high performance over the accumulation period as well as safety in retirement (see, e.g., Berardi, Tebaldi, and Trojani 2018). The insolent performance of Sweden’s AP7 Såfa, which we reported on above and implements a simple life-cycle glide path, testifies of this superior performance: it maintains a full exposure of its participants to the world equity market for most of their active life, before progressively reducing that exposure to one third of their assets over the last decade before retirement. This is both simple to manage, entailing limited costs, and simple to explain to participants.
The condition for such an approach to deliver the best outcome for investors is, however, that their assets remain locked until retirement, with very limited possibilities to make early withdrawals: because equity markets are volatile, investors have no guarantee to recoup their capital before the glide path has significantly reduced their exposure to equity. This necessary patience implies that there must be a clear distinction between pension products—made for patient investment—and investment products intended to serve shorter-term goals. Products designed and marketed to serve both as both pension savings vehicle and short-term investment—or, worse, as rainy-day funds—must offer stability at all time, which leads the managers of these products to over-invest in fixed-income assets offering stable returns but a lower long-term performance.
We therefore strongly support the Commission’s proposal, for the simplification of the Basic PEPP, to set a simple life-cycling approach with a glide path as the default risk mitigation technique. We would also encourage Member States to review the legal framework governing their respective national PPPs to clarify their long-term orientation while in parallel developing simple and cost-efficient savings and investment accounts (SIAs), following the Commission’s recommendation on SIAs (European Commission 2025b).
Nevertheless, we view with concern the removal of the fee cap on the Basic PEPP and its replacement with a “value for money approach”, supposed to ensure that offers of Basic PEPPs remain cost-efficient while enabling providers to levy higher annual costs on PEPP holders. In the absence of a strong and credible value for money supervision system—on that account, the RIS negotiation does not seem set on delivering rules capable of ensuring a strong protection of investors’ interests—the fee cap remains the best guarantee that the Basic PEPP plays its role of affordable, low-cost option to spur competition in markets where such affordable low-cost options do not exist.
Resolutely turn to a long-term approach, for better returns
In the previous editions of this report, BETTER FINANCE consistently called on policymakers to fix the fixed-income bias in the investment policies of pension fund, PPP and other long-term investment managers. Therefore, we strongly support the Commission’s initiatives under the SIU to identify and adopt “measures to stimulate equity investments by institutional investors” (European Commission 2025a, 11), including amendments to the Solvency II delegated acts as regard long-term equity investments.
As regards IORPs, we welcome the Commission’s proposal to introduce “a more principles-based prudent person principle” and to restrict possibilities for Member States to impose uniform quantitative rules on investment policies of IORPs. A risk-based approach whereby pension funds managers are mandated to determine the asset allocation that best serves the interest of its members and to ensure that they have the sufficient expertise to manage these investments, coupled with an empowerment of NCAs to question this management and, where necessary require changes seems appears more likely to enable flexible and effective long-term management of pension investments. We urge the co-legislator to adopt such a risk-based approach, refraining from imposing fixed limits on investment strategies but ensuring that supervisors are sufficiently equipped—in terms of legal powers and staff—to effectively oversee pension funds’ activity.
Besides prudential rules applying to life insurance undertakings and pension funds, tax rules on corporate investments that favour investments in debt securities over investments in equity add an institutional investor’s fixed-income bias to the individual investor’s risk aversion. Or, as the Commission puts it: “[t]he debt bias which characterises taxation systems in many Member States gives undue fiscal incentives to debt financing at the expense of equity financing (European Commission 2025a, 10).
Considering the superior long-term financial performance of equity investments, institutional investors should be incentivised to direct more of their client’s assets towards equity markets, if only to counter the natural risk-aversion of individuals. Therefore, we urge Member States to resume works on the debt-equity bias reduction allowance (DEBRA) initiative submitted to them by the Commission in 2022 , and amend their respective tax regimes in a way that makes them either neutral to the nature of the investment—equity or debt—or, even better, favour equity investments.
Appropriate conditions to set auto-enrolment
BETTER FINANCE is, generally, supportive of auto-enrolment, but only into occupational pension schemes and provided the right pre-conditions are in place. The Commission, in its communication, rightly notes about auto-enrolment that:
[t]he widespread use of this tool can significantly boost participation rates in supplementary pensions, as evidence shows that individuals, once enrolled, tend to remain in the schemes
Precisely because “individuals, once enrolled, tend to remain in the schemes” we must ensure that these schemes offer adequate long-term returns. A strongly positive long-term track record and a design that is conducive to the right balance balance between high-performance and financial security in old age is, therefore, the primary condition to make auto-enrolment in pension schemes acceptable to EU citizens. If anything this report has shown, it is that such pension schemes are, for now at least, the exception and not the rule.
We strongly welcome the announcement that:
To unlock the potential of occupational pensions, the Commission proposes to modernise the framework in order better to support efficiency and scale. This includes: (i) increasing supervisory focus on costs, returns and scale, as one of the triggers for lowering costs and increasing returns; (ii) increasing transparency on underperformance; and (iii) removing barriers to market-driven consolidation or other ways of promoting economies of scale.
and argue that adopting, effectively implementing such measures and measuring their effects on IORP performance should come first, and setting up auto-enrolment schemes, while desirable, should be considered a medium to long-term policy measure, conditional upon the existence of a set of high-performing occupational pension schemes that could be eligible for automatic enrolment.
Even then, individuals should remain free to choose among a range of options to be enrolled to, and, should they find that none of the options is suitable to their objectives and needs, be free to opt out. For this to be effective, proper information needs to be provided about the scheme, the contribution rate and its evolution in time, as well as about the various investment options available. Crucially, sufficient time should be left to individuals between the time they receive the information and the time their enrolment becomes effective for them to review the information and communicate their decision to select a non-default setting or to opt-out.
BETTER FINANCE is also a long-standing advocate of including individual investors in collective redress mechanisms at EU and national level. Collective redresses mechanisms are a tested way to empower individuals who may have suffered damages from large companies. Individual investors who may have suffered due to the poor design or mismanagement of a long-term investment or pension saving scheme should be able to have their interests collectively represented in an easy and costless manner. This becomes all the more important if we consider the introduction of auto-enrolment schemes across the EU. With such systems in place, participation into occupational pensions is indeed likely to increase drastically, mismanagement of a pension scheme to which potentially millions of individuals might be enrolled automatically would entail detriment on a massive scale. The likelihood of massive damages to be paid in case of such mismanagement would greatly contribute to ensuring that pension funds indeed manage their members’ assets according to the prudent person principle.
Acronyms
- CEE
- Central and Eastern Europe
- COVIP
- .na.character
- DC
- Defined contributions
- DEBRA
- debt-equity bias reduction allowance
- ECB
- European Central Bank
- EEE
- Exempt Exempt Exempt
- EET
- Exempt Exempt Taxed
- EIOPA
- European Insurance and Occupational Pensions Authority
- ETF
- exchange-traded fund
- ETT
- Exempt Taxed Taxed
- EU
- European Union
- FIRE
- Financial Independence Retire Early
- IKE
- indywidualne konta emerytalne
- IORP
- institution for occupational retirement provision
- IORP II
- Directive on Institutions for Occupational Retirement Provisions
- ISC
- Indicatore Sintetico dei Costi
- KID
- Key Information Document
- KIID
- Key Investor Information Document
- NCA
- national competent authority
- OECD
- Organisation for Economic Co-operation and Development
- OIPE
- ogólnoeuropejski indywidualny produkt emerytalny
- PAYG
- pay-as-you-go
- PEPP
- Pan-European Personal Pension
- PPP
- personal pension product
- PRIIP
- packaged retail or insurance-based investment product
- PTS
- pension tracking system
- RIS
- Retail Investment Strategy
- SIA
- savings and investment account
- SIU
- Savings and Investments Union
- TEE
- Taxed Exempt Exempt
- TER
- total expense ratio
- TET
- Taxed Exempt Taxed
- TTE
- Taxed Taxed Exempt
- UCITSD
- UCITS Directive
- US
- United States
- p.a.
- per annuum
- p.p.
- percentage point
In box plots of the kind presented in Figure 2.7, the boundaries of the box represent the interquartile range of the distribution, i.e., where 75% of the data is located, while the range covered by the box plus the whiskers cover roughly 99% of the data, remaining outliers are displayed with a black circle. The thick line in the middle of the box corresponds to the median value of the distribution.↩︎
“Mind the Pension Gap: Delivering Adequate, Inclusive and Portable Pensions in the Current EU Cycle”, December 2nd, 2025, European Parliament, Brussels.↩︎
In Austrian life insurance: these entry fees are spread over the first few years of the contract and not paid-in entirely in the first year, which somewhat softens the blow (see Chapter 3). But still…↩︎
The “Supplementary pension package” includes a legislative proposal to amend the Directive on Institutions for Occupational Retirement Provisions (IORP II) (European Commission 2025f), a legislative proposal to amend the PEPP Regulation (European Commission 2025e) as well as a recommendation to the Member States on pension tracking systems (PTSs), pension dashboards and auto-enrolment (European Commission 2025c).↩︎
See www.forbrukerradet.no, “Finansportalen”, which provide comparison tools for bank services, investment funds and pension products.↩︎